
A man of sixty-eight asks to have his hearing loss recognised as occupational. He spent three decades in a fabrication plant and has been retired for five years. His audiogram shows a clean down-sloping curve, worse at every step from 2 kHz upward, with no dip and no recovery. The 4 kHz notch that textbooks call the signature of noise damage is not on the page.
Read quickly, that looks like age rather than noise. But the missing notch says less about his exposure than most readers assume, and the reasons are worth going through.
Start with how consistently the sign can be read at all. When three clinicians were asked to identify notches in the same set of 634 audiograms from noise-exposed employees, their positive rates came out at 0.26, 0.49 and 0.68 [McBride & Williams, Characteristics of the Audiometric Notch, 2001]. One reader found the sign in a quarter of the records, another in more than two-thirds. They were reading the same pages. The study involved only three readers, so it cannot settle how wide the disagreement runs in general practice, but the spread within it is hard to wave away.
The physical explanation for why noise damages high frequencies is solid. Whether that explanation supports the notch as a diagnostic test is a separate question.
The Physics Behind the 4 kHz Notch
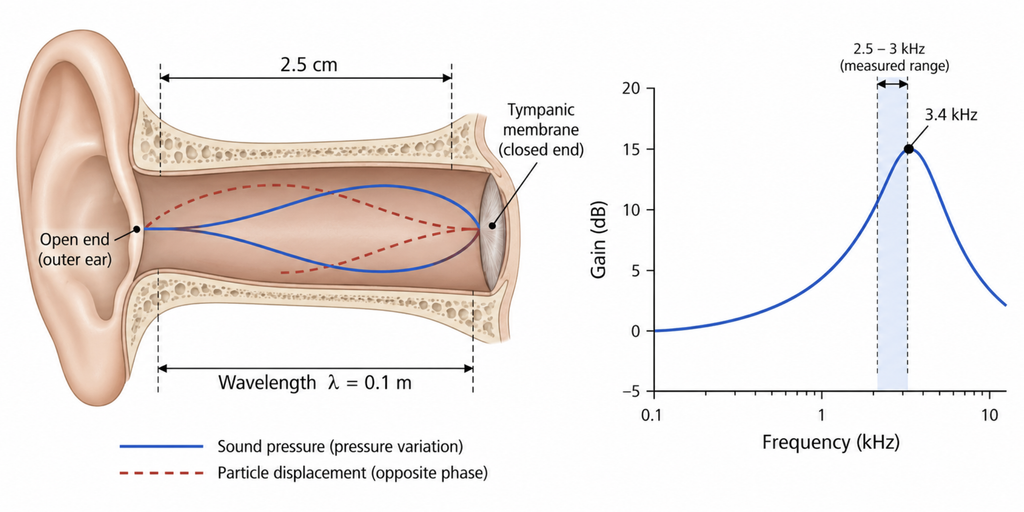
The ear canal is a tube closed at one end by the tympanic membrane. Any such tube resonates, and the standard model treats it as a quarter-wavelength resonator: the canal length equals one quarter of the wavelength it amplifies most strongly.
The arithmetic is elementary. Sound travels at roughly 340 metres per second at room temperature. Taking an adult canal length of about 2.5 cm, the resonant wavelength is four times that, or 0.1 m. Divide speed by wavelength and the resonant frequency lands near 3,400 Hz.
That is why noise damage concentrates in the high frequencies rather than the low ones. Before a sound ever reaches the cochlea, the outer ear has already amplified a band of frequencies in the low kilohertz range. The hair cells tuned to that band receive more energy than their neighbours for the same environmental sound, and over years of exposure they pay for it.
This is an idealised calculation rather than a measurement. A real ear canal is not a rigid tube, the eardrum is not a rigid termination, and the concha adds acoustic effects the simple model leaves out. Real-ear measurements generally place the peak somewhat below the calculated figure, in the region of 2.5 to 3 kHz; one series of normal adult ears measured an average closer to 2.1 kHz [Jang, Changes in External Ear Resonance, 2002], from a sample of forty ears.
Clinical Perspective
The resonance argument is usually offered as the explanation for the notch, full stop. It explains direction better than it explains position: it accounts for why the damage climbs into the high frequencies, not for which frequency takes the worst of it. That gap matters once a compensation claim turns on a particular frequency.
Why 4 kHz and Not 3 kHz?
Most accounts step over a problem here. The resonance calculation points to roughly 3.4 kHz, and measurement points lower still. The notch is named for 4 kHz. The term c5-dip, still in common use, comes from the German musical notation in which c5 denotes 4,096 Hz. So the name carries a frequency the acoustics do not predict.
Two arguments close part of that distance.
The first is the half-octave shift. In animal experiments, the maximum threshold shift after intense tonal exposure does not occur at the exposure frequency but roughly half an octave above it. Single-neuron recordings in guinea pigs showed that the exposure frequency most effective at causing a threshold shift at a given neuron’s characteristic frequency sat half an octave below that characteristic frequency [Cody & Johnstone, Acoustic Trauma, 1981]. Apply that displacement to a resonance in the high 2 kHz or low 3 kHz range and the damage lands near 4 kHz. The authors proposed that basilar membrane nonlinearity produces this shift, and that explanation remains a proposal rather than a settled account.
The second is that the outer ear is not the only variable. The American College of Occupational and Environmental Medicine states plainly that the exact location of the notch depends on several factors, among them the frequency content of the damaging noise and the size of the ear canal [Mirza et al., Occupational Noise-Induced Hearing Loss, 2018]. A larger canal resonates lower. A worker whose daily exposure is dominated by machine noise at one frequency band and a worker exposed to broadband noise are not predicted to notch at the same place.
The resonance model accounts for the high-frequency direction of the damage. It does not by itself place that damage at 4 kHz.
The Notch Has No Single Definition
An incomplete mechanistic story would matter less if the marker performed well in practice. The larger problem is that there is no agreed rule for what counts as a notch, and the competing rules disagree with each other.
Four published algorithms were applied to the same population-based cohort of 2,395 older adults. The prevalence of notched audiograms came out at 11.7%, 25.9%, 31.7% and 47.2% depending on which rule was used [Nondahl et al., Notched Audiograms and Noise Exposure History, 2009]. The same ears, examined with the same audiometry, produced a fourfold difference in how many people were classified as carrying the sign. The authors concluded that agreement across existing algorithms is poor and urged caution about using notched audiograms to classify noise-induced hearing loss.
| What varies | Why it changes the answer |
|---|---|
| Which frequencies count as the notch | Rules differ on whether 3, 4 and 6 kHz all qualify or only some |
| How deep the dip must be | Depth thresholds differ; a shallow dip passes one rule and fails another |
| Which frequencies serve as the shoulders | Comparison against 1 kHz, 2 kHz, or both changes the result |
| How much recovery is required at 8 kHz | Some rules demand a defined return, others do not |
| One ear or both | Some algorithms accept a notch in either ear, others require both |
The second problem is specificity. Among participants with a notched audiogram in that cohort, between 28.1% and 33.0% had no history of occupational noise exposure at all, depending on the algorithm. Roughly one in three people carrying the sign had never worked in noise. A smaller group, between 7.6% and 13.6%, had no history of occupational noise, noisy hobbies or firearm use, and so no identified noise source of any kind.
Population data point the same way. In a cross-sectional study of 12,055 railway workers, the 4 kHz notch appeared in 31% of male noise-exposed maintenance workers and 21% of male non-exposed traffic controllers [Lie et al., Prevalence of Notched Audiograms, 2015]. The difference is real and statistically solid, and it is also narrow. A qualification belongs with it: the exposed group worked at 75 to 90 dB(A) rather than in the highest-intensity environments, while controls sat below 70 dB(A). This is a comparison across a moderate exposure contrast, and even so, a majority of exposed workers did not show the sign while a substantial minority of unexposed workers did.
Can noise-induced hearing loss exist without a notch?
Yes, and the reverse happens too. Some workers with genuine exposure never develop a notch, and some people with no noise history have one. A sign that fails in both directions carries less diagnostic weight than its reputation suggests.
Clinical Perspective
The notch is often treated as though it confirms a diagnosis. On these numbers it works better as a supporting detail: useful when the exposure history is already strong, close to meaningless when it stands alone. In a compensation setting the temptation is to read the audiogram first and the work history second. That order should be reversed.
How Age Erases the Notch
A notch is not simply elevated thresholds at 3, 4 or 6 kHz. It is elevated thresholds at those frequencies with recovery at 8 kHz, a dip with a far shoulder. Remove the shoulder and the shape no longer meets the definition.
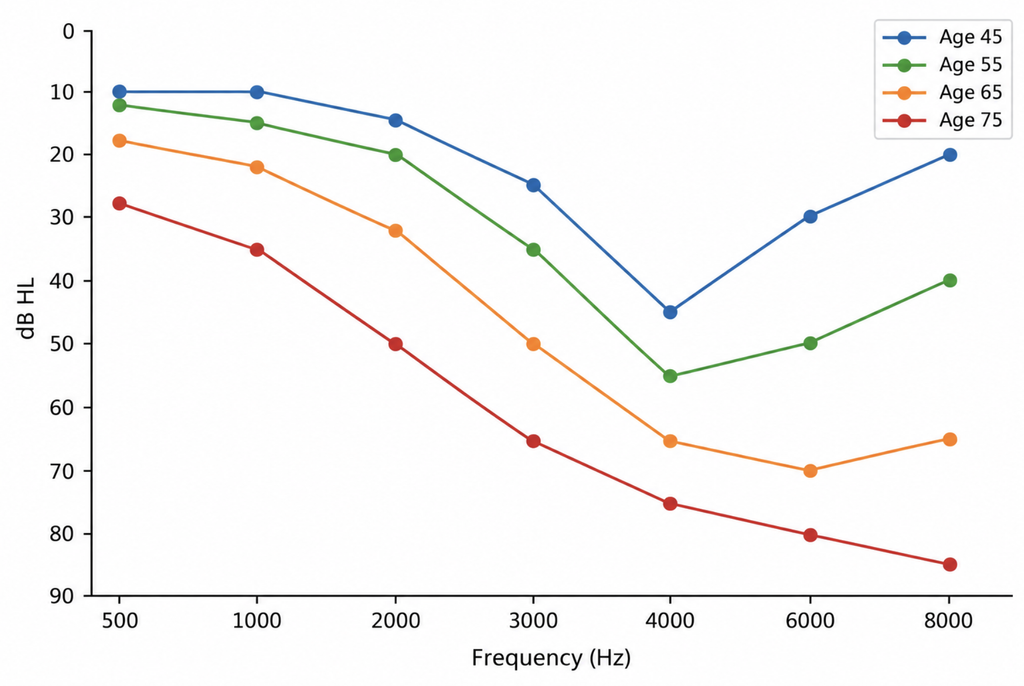
Age-related hearing loss does exactly that. It produces high-frequency loss in a down-sloping pattern without recovery at 8 kHz. As it advances, the 8 kHz threshold falls, the far shoulder disappears, and what was a notch becomes a slope. ACOEM describes the process directly: the notch widens into adjacent frequencies with continued exposure, and this together with the effects of aging may reduce its prominence, so that in older individuals the effects of noise become difficult to distinguish from presbycusis without access to earlier audiograms [Mirza et al., Occupational Noise-Induced Hearing Loss, 2018].
The underlying damage has not gone anywhere. The audiogram has simply stopped meeting the shape requirement.
Prevalence data show the contamination running the other direction as well: notch prevalence rises with increasing age in both exposed and unexposed groups [Lie et al., Prevalence of Notched Audiograms, 2015]. Age creates spurious notches in the middle decades and erases genuine ones later.
There is also a regulatory gap. Identifying a notch requires testing at 8 kHz, since without it the far shoulder cannot be assessed. United States occupational regulation does not require audiometric testing at that frequency, and ACOEM recommends including it precisely because it assists in identifying both the noise notch and age-related loss [Mirza et al., Occupational Noise-Induced Hearing Loss, 2018]. The frequency that decides whether the sign exists is one that surveillance programmes are not obliged to measure.
Clinical Perspective
This is why serial audiograms outrank any single one. A notch caught at forty-five and documented is worth more than any inference drawn from a seventy-year-old’s audiogram, because by seventy the evidence has been overwritten. Hearing conservation programmes that retain records are, in effect, preserving diagnostic evidence for a claim that may not be filed for another twenty years.
What the Notch Can and Cannot Do
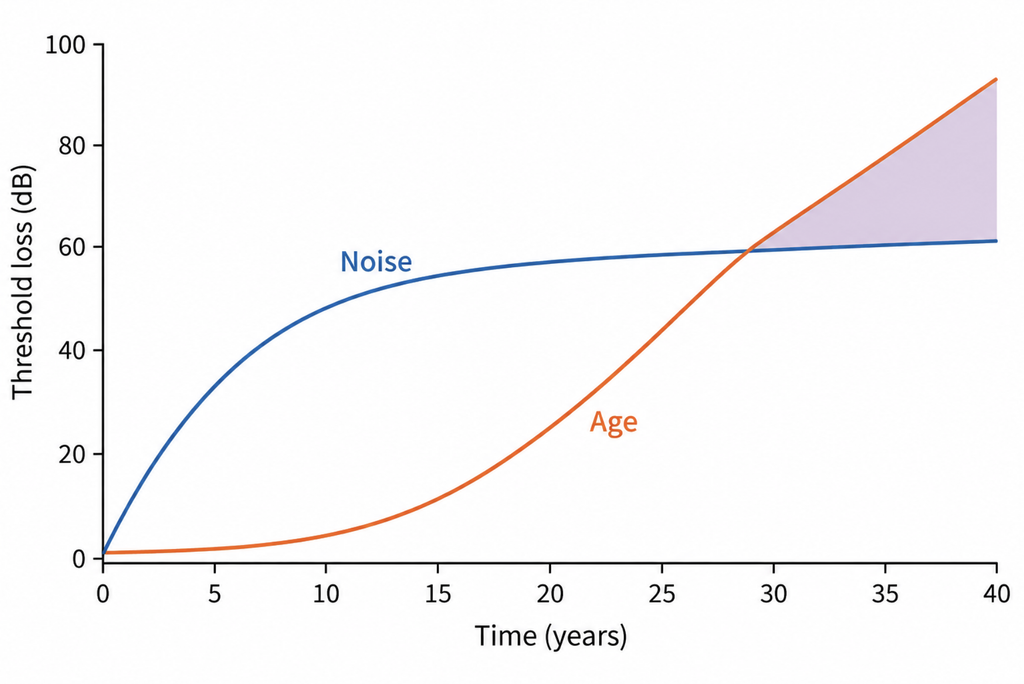
Timing is the structural problem. The notch is an early sign, and the question of causation is usually asked late.
Noise-induced hearing loss develops over years. Threshold loss rises most steeply during the first ten to fifteen years of exposure and then decelerates, in contrast to age-related loss, which accelerates over time [Mirza et al., Occupational Noise-Induced Hearing Loss, 2018]. By the time a worker retires and files a claim, the noise component has largely plateaued while the age component is gaining speed. The two are superimposed, and the marker that distinguished them has been flattened.
A long-standing premise holds that noise-induced loss stops progressing once exposure ends, and compensation systems are built on it. It remains the working assumption, though the current professional statement expresses it more cautiously than earlier versions did: ACOEM writes that the evidence is insufficient to conclude that noise-related hearing loss will progress after exposure is discontinued, while noting animal work showing cochlear afferent nerve terminal damage and delayed degeneration of the cochlear nerve after exposures that left thresholds recovered [Kujawa & Liberman, Adding Insult to Injury, 2009; Mirza et al., Occupational Noise-Induced Hearing Loss, 2018]. That work is in rodents, and it does not establish that human thresholds follow the same course.
Two boundary conditions help in practice. Noise alone does not usually produce losses greater than 75 dB at high frequencies or 40 dB at low frequencies, though individuals with presbycusis or other non-noise causes may exceed those values, so the rule excludes more reliably than it confirms [Mirza et al., Occupational Noise-Induced Hearing Loss, 2018].
In place of a single sign, the standard approach uses a combination of findings. The most widely used medicolegal framework requires three findings together: high-frequency impairment, a potentially hazardous amount of noise exposure, and an identifiable high-frequency notch or bulge. Four modifying factors sit alongside them, covering the clinical picture, compatibility with age and exposure, criteria for other causation, and complications such as asymmetry or mixed hearing loss [Coles, Lutman & Buffin, Guidelines on the Diagnosis of NIHL, 2000]. It is widely applied, though it was written for the legal context of the United Kingdom rather than as an international standard.
The notch sits inside that structure as one requirement among several, weighted by exposure history rather than standing in place of it.
Clinical Perspective
Return to the sixty-eight-year-old with the clean slope and no dip. Nothing about that audiogram rules out three decades of industrial noise; it is exactly what three decades of industrial noise looks like after five more years of aging on top. The audiogram alone cannot answer the question. The exposure record, the dose, the duration and any audiogram taken while he was still working can. A missing notch does not mean a missing injury. Often it means an old one.
Key Takeaways
The ear canal’s quarter-wavelength resonance explains why noise damage favours high frequencies, but the calculation points below 3.4 kHz while the notch is named for 4 kHz.
The half-octave shift observed in animal work, combined with the frequency content of the offending noise and individual canal size, accounts for part of that gap.
Four published notch definitions applied to one cohort produced prevalences ranging from 11.7% to 47.2%, a fourfold spread from the same audiograms.
Roughly one in three people with a notched audiogram in that cohort had no occupational noise history at all.
A notch requires recovery at 8 kHz, so advancing age-related loss erases the sign without removing the underlying damage.
Serial audiograms taken during working life carry more diagnostic weight than any single audiogram taken after retirement.
FAQ
Why does noise damage 4,000 Hz first?
Partly because of outer ear acoustics, partly because of cochlear mechanics. The ear canal amplifies a band in the low kilohertz range, and threshold shift peaks roughly half an octave above the stimulating frequency, which pushes the damage upward toward 4 kHz [Cody & Johnstone, Acoustic Trauma, 1981]. Canal size and the spectrum of the specific noise both move the location [Mirza et al., Occupational Noise-Induced Hearing Loss, 2018].
Can a person have noise-induced hearing loss without a 4 kHz notch?
Yes. The notch is an early-stage finding that widens and then flattens with continued exposure and advancing age, which is why noise effects in older individuals are difficult to separate from presbycusis without earlier audiograms [Mirza et al., Occupational Noise-Induced Hearing Loss, 2018].
Does a notch prove someone was exposed to hazardous noise?
No. In a population-based cohort, between 28.1% and 33.0% of people with a notched audiogram had no occupational noise history, and 7.6% to 13.6% had no identified noise exposure of any kind [Nondahl et al., Notched Audiograms and Noise Exposure History, 2009].
How do clinicians separate noise-induced loss from age-related loss?
Not by audiogram shape alone. Established frameworks combine high-frequency impairment, documented hazardous exposure and an identifiable notch or bulge with modifying factors including compatibility with the patient’s age [Coles, Lutman & Buffin, Guidelines on the Diagnosis of NIHL, 2000]. Previous audiograms are the single most useful additional piece of evidence.
References
- McBride D, Williams S. Characteristics of the audiometric notch as a clinical sign of noise exposure. Scand Audiol. 2001;30(2):106-111.
- McBride DI, Williams S. Audiometric notch as a sign of noise induced hearing loss. Occup Environ Med. 2001;58(1):46-51.
- Nondahl DM, Shi X, Cruickshanks KJ, Dalton DS, Tweed TS, Wiley TL, Carmichael LL. Notched audiograms and noise exposure history in older adults. Ear Hear. 2009;30(6):696-703.
- Lie A, Skogstad M, Johnsen TS, Engdahl B, Tambs K. The prevalence of notched audiograms in a cross-sectional study of 12,055 railway workers. Ear Hear. 2015;36(3):e86-e92.
- Coles RR, Lutman ME, Buffin JT. Guidelines on the diagnosis of noise-induced hearing loss for medicolegal purposes. Clin Otolaryngol Allied Sci. 2000;25(4):264-273.
- Mirza R, Kirchner DB, Dobie RA, Crawford J; ACOEM Task Force on Occupational Hearing Loss. Occupational noise-induced hearing loss. J Occup Environ Med. 2018;60(9):e498-e501.
- Cody AR, Johnstone BM. Acoustic trauma: single neuron basis for the “half-octave shift.” J Acoust Soc Am. 1981;70(3):707-711.
- Kujawa SG, Liberman MC. Adding insult to injury: cochlear nerve degeneration after “temporary” noise-induced hearing loss. J Neurosci. 2009;29(45):14077-14085.
- Jang CH. Changes in external ear resonance after mastoidectomy: open cavity mastoid versus obliterated mastoid cavity. Clin Otolaryngol Allied Sci. 2002;27(6):509-511.
Joonpyo Hong, MD is a board-certified otolaryngologist practicing in Korea. This article reflects his clinical interpretation of published research and does not constitute individual medical advice.
This article is not intended to advertise or promote any specific company or product.
For more articles:
https://curiousmd.com/age-related-hearing-loss-hear-not-understand/
https://curiousmd.com/hyperbaric-oxygen-for-sudden-hearing-loss/
https://curiousmd.com/earbud-hearing-loss-ent-guide/
Link out to:
ACOEM guidance statement on occupational noise-induced hearing loss: https://doi.org/10.1097/JOM.0000000000001423
Coles, Lutman and Buffin medicolegal diagnostic guidelines: https://doi.org/10.1046/j.1365-2273.2000.00368.x
Nondahl and colleagues on disagreement between notch algorithms: https://doi.org/10.1097/AUD.0b013e3181b1d418
Lie and colleagues on notch prevalence in 12,055 railway workers: https://doi.org/10.1097/AUD.0000000000000129
Kujawa and Liberman on delayed cochlear nerve degeneration: https://doi.org/10.1523/JNEUROSCI.2845-09.2009