
Play a 20-decibel hum at 60 Hz and a 20-decibel hum at 3,000 Hz, and you meet the whole problem of subjective vs objective sound in one breath. The microphone insists the two are identical in level. Your ear disagrees completely — the low hum nearly vanishes while the higher one sits plainly in the room. That single mismatch is the entire story here: the sound instruments measure and the sound people hear are two different things, and confusing them causes real problems in medicine, audio engineering, and product design.
By the end you will be able to name the components of each, explain exactly how they diverge, understand why scientists insisted on separating them, spot the gap in daily life, and see which industries live on which side.
The Objective Sound: What a Microphone Measures
Objective sound is the physical event — a pressure wave traveling through air — described entirely by numbers that exist whether or not anyone is listening. Four properties define it.
Frequency is how many times per second the wave oscillates, measured in hertz (Hz). A piano’s middle A vibrates at 440 Hz. Frequency is a pure count; it does not care about your ears.
Amplitude is the size of the pressure fluctuation — how far the wave pushes and pulls the air. Larger amplitude carries more energy. It is usually expressed on the decibel (dB) scale, which is logarithmic because the range of pressures we deal with is enormous.
Waveform is the shape of the wave over one cycle, set by the mixture of a fundamental frequency and its overtones (harmonics). A flute produces a nearly clean shape; a violin’s is jagged and rich. Two sounds can share frequency and amplitude yet have entirely different waveforms.
Duration is simply how long the pressure event lasts, in seconds or milliseconds — the objective clock time of the sound.
Every one of these can be captured by a microphone and plotted on a screen. No human required.
The Subjective Sound: What Your Brain Constructs
Subjective sound is the perception — what the auditory system builds after the wave reaches the eardrum, travels through the cochlea, and is decoded by the brain. It has its own three classic elements, and each one loosely corresponds to a physical property but never matches it perfectly.
Pitch is the sensation of “high” or “low.” It tracks frequency, but not linearly and not exclusively — loudness and overtone structure nudge perceived pitch too.
Loudness is the sensation of “soft” or “strong.” It tracks amplitude, but it also depends heavily on frequency and duration. Loudness is measured in perceptual units — the phon (loudness level) and the sone (loudness ratio), where doubling the sones means the sound feels twice as loud.
Timbre — sometimes called tone color— is everything that lets you tell a trumpet from a clarinet playing the same note at the same volume. It arises mainly from waveform and how overtones evolve over time. Timbre is not a single number; it is a multidimensional impression the brain assembles from spectral and temporal cues [Thoret, Learning metrics on spectrotemporal modulations reveals the perception of musical instrument timbre, 2021].
Notice the pattern: pitch, loudness, and timbre are experiences. They live in perception, not in the air.
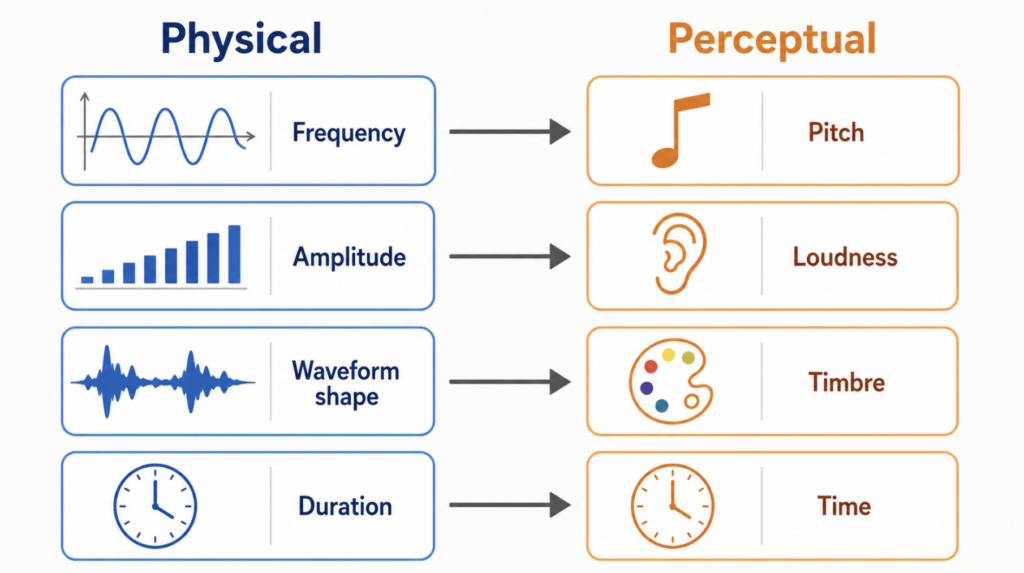
Subjective vs Objective Sound: A Direct Mapping
The cleanest way to hold this in your head is a one-to-one table between the physical cause and the perceived effect.
| Objective (physical, measurable) | Subjective (perceptual, felt) | Relationship |
|---|---|---|
| Frequency (Hz) | Pitch | Higher frequency → higher pitch, but non-linear |
| Amplitude (dB) | Loudness (phon/sone) | Higher amplitude → louder, but frequency-dependent |
| Waveform / harmonics | Timbre | Overtone mix and time envelope → tone color |
| Duration (physical time) | Perceived length / loudness buildup | Very short sounds seem quieter and less pitched |
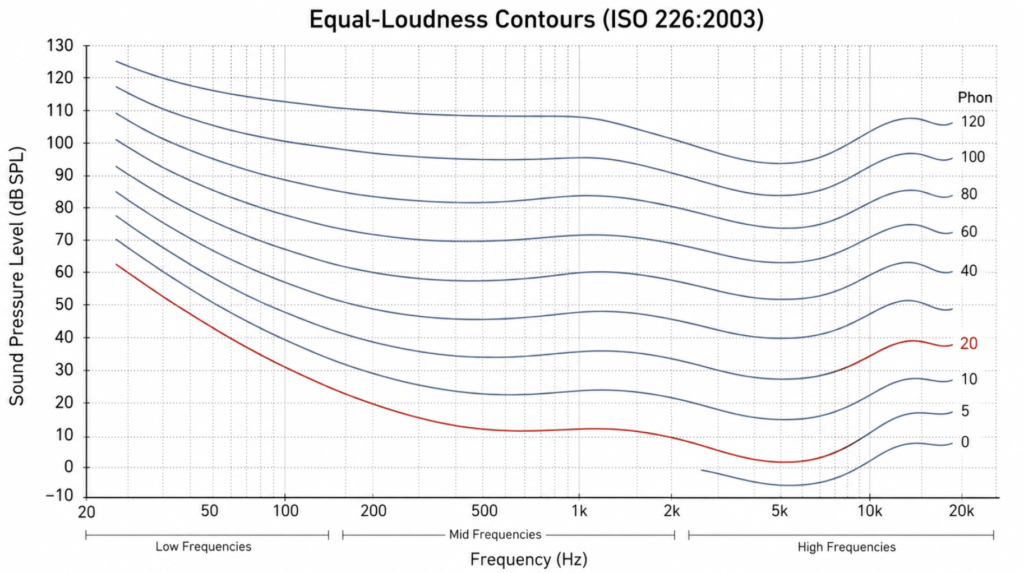
The relationships are real but bent. The best-documented bend is loudness. Human hearing is most sensitive in the 2,000–5,000 Hz band and far less sensitive at the low and high extremes. A tone at 100 Hz must carry much more physical energy than a tone at 3,000 Hz to be judged equally loud. That relationship is captured in the internationally standardized equal-loudness contours, refined from decades of listening experiments [Suzuki, Equal-loudness-level contours for pure tones, 2004]. This is precisely why the identical-decibel hums from the opening sound so different.
Why We Bother Separating Them
If the two lined up perfectly, one scale would do. They do not, so history forced the split.
In the 1930s, engineers at Bell Labs — Harvey Fletcher and Wilden Munson among them — needed to design telephones and audio equipment that sounded right to humans, not just measured right on a meter. They ran systematic listening tests and discovered that equal decibels did not mean equal loudness across frequencies. That finding made a purely physical description of sound insufficient for any product meant for human ears, and it launched the field of psychoacoustics: the study of how physical sound maps onto perception.
The practical payoff is large. Loudness models that account for the ear’s frequency response can predict perceived loudness and even hearing thresholds far better than raw decibels [Glasberg, Prediction of absolute thresholds and equal-loudness contours using a modified loudness model, 2006]. Without the subjective/objective distinction, a hearing aid would amplify every frequency equally and sound harsh; a music streaming codec could not throw away “inaudible” data; a noise regulation would punish frequencies people barely notice while ignoring the ones that actually annoy.
Clinical Perspective An audiogram is this distinction turned into a test. It plots the objective stimulus — frequency in Hz against intensity in dB — versus the listener’s subjective report of whether the tone was heard. The recorded threshold is the exact point where physics crosses over into perception. A common clinical complaint, “I can hear people talking but I can’t understand them,” describes a breakdown in the subjective processing of speech timbre and clarity that a single loudness number will never capture. Sound care means respecting both columns of that table at once.
Everyday Encounters with the Gap
Once you know the split exists, you notice it constantly.
Turn your music down low at night and the bass and the sparkle both seem to disappear, leaving a thin midrange. The physical spectrum barely changed proportionally; your ear’s sensitivity at low volume did, exactly as the equal-loudness contours predict. This is why many audio systems include a “loudness” button that boosts bass and treble at low volumes to compensate.
A car alarm at 3,000 Hz feels piercing; a truck’s low rumble at the same decibel level feels merely present. The physics call them equal; your perception does not.
The “cocktail party” experience is another: in a noisy room your brain isolates one voice from a physically tangled wave, using timbre and spatial cues that no single microphone reading contains. And the reason you rarely recognize your own recorded voice is timbre — recordings drop the bone-conducted low frequencies you normally hear, so the objective capture and your subjective self-image diverge.
Industries Built on One Side or the Other
Different industries deliberately optimize for one column of the table.
Subjective-first fields care about how sound is experienced. The music and audio-production industry masters tracks to perceived loudness targets (measured in LUFS, a perceptual unit) rather than raw peaks. Automotive companies employ “sound design” and psychoacoustic engineering so a car door “thunk” or an electric motor whine feels premium. Consumer electronics tune speakers and earbuds to flatter human hearing curves. Streaming codecs like MP3 and AAC exploit perceptual masking — discarding sounds the brain would not notice — to shrink files. And clinical audiology, of course, is built on the patient’s subjective response.
Objective-first fields care about the sound as a measurable physical quantity. Environmental and occupational noise regulation sets legal limits in weighted decibels for safety and compliance. Acoustic and structural engineers measure sound transmission and absorption for building design. Industrial and predictive maintenance teams analyze machine vibration spectra to catch failing bearings long before a human would hear a problem. Sonar, ultrasound imaging, and non-destructive testing use frequencies humans cannot perceive at all, where only the physics matters.
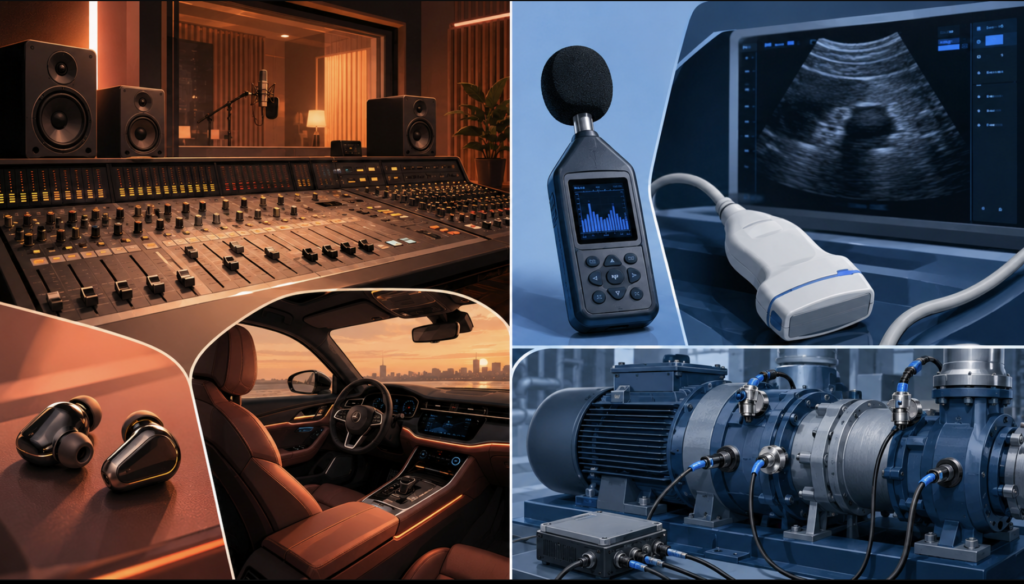
The best-designed products respect both: a hearing aid is engineered with objective precision to serve a subjective goal.
Key Takeaways
- Objective sound has four measurable properties — frequency, amplitude, waveform, and duration — that exist independent of any listener.
- Subjective sound has three perceived qualities — pitch, loudness, and timbre — constructed by the brain and measured in perceptual units like the phon and sone.
- The two are related but non-linear: equal decibels do not mean equal loudness, because human hearing is most sensitive around 2,000–5,000 Hz.
- The distinction exists because purely physical measurements failed to predict human experience, giving rise to the field of psychoacoustics.
- Subjective-first industries (music, audio, automotive, audiology) optimize perception; objective-first industries (noise regulation, acoustic engineering, ultrasound) optimize measurable physics.
FAQ
Why do two sounds at the same decibel level seem different in loudness? Because loudness depends on frequency, not just amplitude. The human ear is far more sensitive in the 2,000–5,000 Hz range, so a mid-frequency tone sounds louder than a low- or high-frequency tone of identical decibel level. This frequency-dependent sensitivity is mapped by equal-loudness contours.
What is the difference between a decibel and loudness? A decibel is an objective, physical measure of sound amplitude. Loudness is the subjective sensation of strength, measured in phons or sones. The same decibel value can produce very different loudness depending on frequency and duration, which is why the two scales are not interchangeable.
What determines timbre? Timbre is set mainly by a sound’s waveform — the specific mixture of a fundamental frequency and its overtones — and by how that spectrum changes over time. It is what lets you distinguish a violin from a flute playing the same pitch at the same volume, and the brain assembles it from multiple spectral and temporal cues.
Is pitch the same as frequency? No. Frequency is the objective count of oscillations per second; pitch is the perceived highness or lowness. Pitch generally rises with frequency but not in a perfectly linear way, and it can be subtly influenced by loudness and overtone structure.
References
Suzuki Y, Takeshima H. Equal-loudness-level contours for pure tones. J Acoust Soc Am. 2004;116(2):918-933.
Glasberg BR, Moore BCJ. Prediction of absolute thresholds and equal-loudness contours using a modified loudness model. J Acoust Soc Am. 2006;120(2):585-588.
Thoret E, Caramiaux B, Depalle P, McAdams S. Learning metrics on spectrotemporal modulations reveals the perception of musical instrument timbre. Nat Hum Behav. 2021;5(3):369-377.
Joonpyo Hong, MD is a board-certified otolaryngologist practicing in Korea. This article reflects his clinical interpretation of published research and does not constitute individual medical advice.
For more interesting contents:
https://curiousmd.com/hear-better-when-you-look/
https://curiousmd.com/age-related-hearing-loss-hear-not-understand/
https://curiousmd.com/tms-therapy-conditions-tinnitus/
Link out to:
https://www.nidcd.nih.gov/health/how-do-we-hear
https://en.wikipedia.org/wiki/Equal-loudness_contour
https://en.wikipedia.org/wiki/Psychoacoustics