
Global aging is no longer a forecast; it is a fact already loaded into the world’s age pyramid. By the late 2070s, the number of persons aged 65 and older worldwide will reach 2.2 billion and surpass the number of children under 18, according to the United Nations [UN DESA, World Population Prospects 2024]. By the mid-2030s — within a single career cycle — those aged 80 and older will outnumber infants. The global fertility rate, around 5 children per woman in 1960, sits at 2.25 in 2024 and is projected to fall below the 2.1 replacement level by the late 2040s. These are not speculative projections. They are functions of women already born.
Into this irreversible demographic shift walks artificial intelligence — pitched, in turn, as a productivity multiplier for shrinking workforces, a substitute for absent caregivers, a discoverer of longevity drugs, and a screening layer for the diseases of late life. The promise is that algorithmic medicine can compress the years of frailty inside a longer total lifespan, easing the fiscal weight of aging. The skeptical counter is that AI medicine arrives most powerfully exactly where the demographic burden is lightest, and barely at all where, by the math, that burden will be heaviest.
The world is not aging at the same rate, for the same reasons, or with the same resources. What follows is a region-by-region map of that asymmetry, and an honest accounting of where intelligent machines can — and cannot — bend a curve already set by births, deaths, and time.
The Mathematics of an Aging Planet
People aged 65 and over numbered 703 million in 2019 and reached roughly 1 billion in 2024; by 2050 that figure will reach 1.6 billion, and by the late 2070s, 2.2 billion [UN DESA, World Population Ageing 2019; World Population Prospects 2024]. One in eleven people was 65 or older in 2019. By 2050, the ratio will be one in six. Translated into plain language: within a single human generation, the share of older people in the world roughly doubles.
Life expectancy globally rose from 64.0 years in 1990 to 73.3 in 2024, and is projected to reach 77.4 by 2054 [UN DESA, 2024]. By the late 2050s, more than half of all deaths globally will occur at age 80 or higher, compared with 17 per cent in 1995. The average death is becoming a death in old age — a quiet, enormous shift.
Fertility, meanwhile, has fallen further than most policy systems planned for. The global total fertility rate stood at roughly 5 children per woman in the 1960s, 3.3 in 1990, and 2.25 in 2024 [UN DESA, 2024]. The momentum embedded in today’s youthful age structure will still add about 1.4 billion people through 2054, but past that point the math reverses.
The crux: aging is not the population growing old. Aging is what happens when a population stops being replenished from below faster than it survives at the top.
Clinical Perspective. The “longevity revolution” is a medical victory described as a fiscal problem. It is both. The pediatric and infectious-disease wins of the last century moved death from age 5 to age 80; the geriatric problems now dominating health systems are the bill for that success. Any honest framing of global aging begins here: this is not a failure of medicine, but its most expensive achievement.
A Tale of Eleven Regions
The world’s aging map is not a single curve but a set of curves running at different speeds and in different directions.
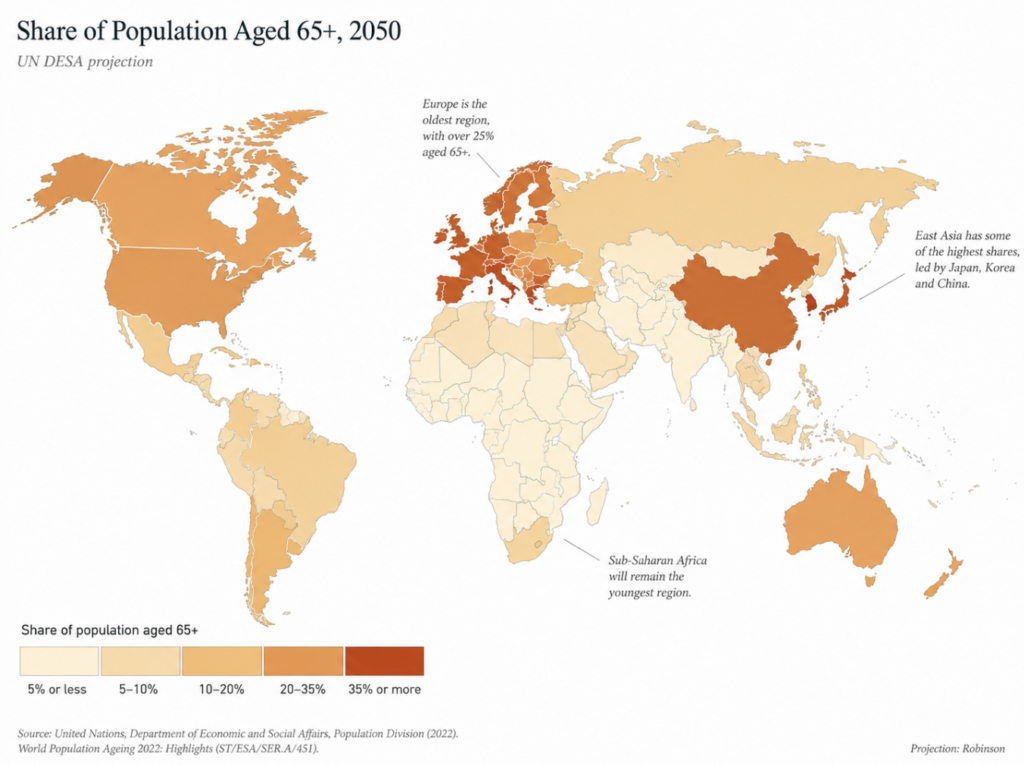
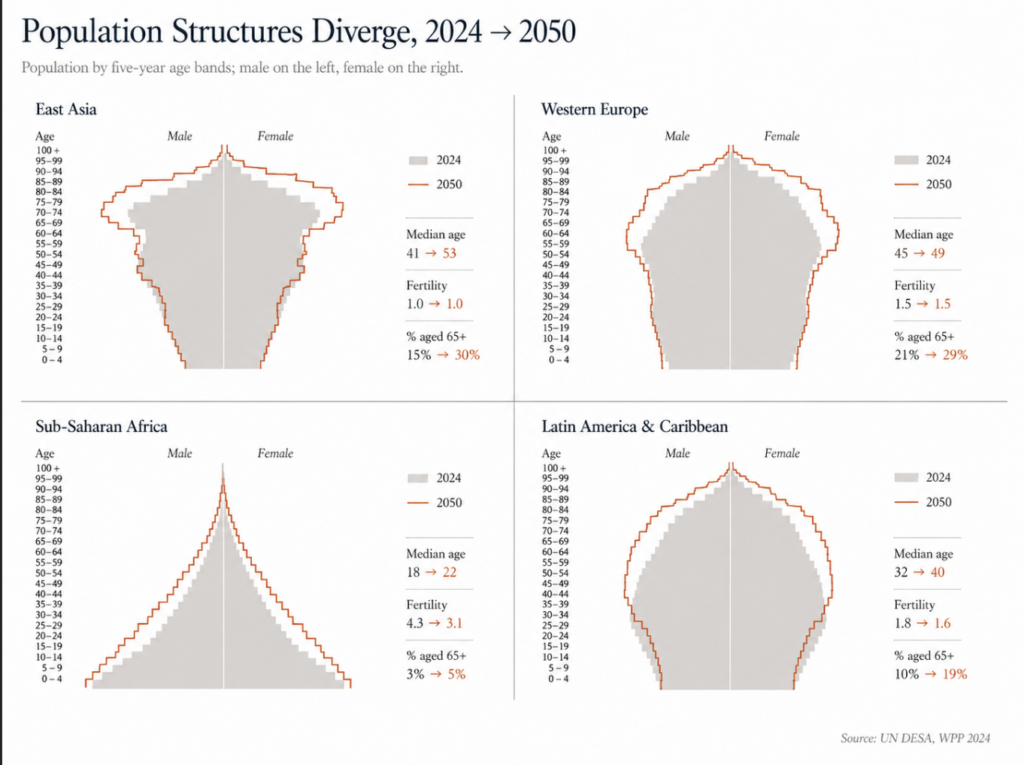
East Asia is aging faster than any region in human history. South Korea’s total fertility rate stood at 0.75 in 2024 — barely a third of replacement, the lowest of any sovereign nation [World Bank, 2024]. China sits at 1.0, Japan at 1.15. The senior share in China rose from 7 per cent in 2000 to 15 per cent in 2024 and is projected to reach roughly 33 per cent by 2050 [UN DESA, 2024]. By 2060, OECD projections place the old-age dependency ratio in Japan and Korea above 80 per cent — more than 80 retirees for every 100 working-age adults [OECD, 2025].
Southern and Eastern Europe are on a similar trajectory. Italy (TFR 1.18), Spain (1.10), Poland (1.14), and most of the Balkans sit well below replacement. Several have begun absolute population decline. Eastern Europe carries the additional weight of emigration; the populations of Albania, Bosnia-Herzegovina, Lithuania, and Moldova are projected to fall sharply by 2054 [UN DESA, 2024].
Western and Northern Europe, by contrast, age more slowly. France (1.61), the United Kingdom (1.55), and the Nordic states sit below replacement but cushion the decline through immigration. Europe’s overall old-age dependency ratio is projected to reach 75 per cent by 2050 — the highest of any major region [IMF, Finance & Development, 2020].
Northern Africa and Western Asia show the fastest proportional rise in older persons in the world: a 226 per cent increase between 2019 and 2050, from 29 million to 96 million older adults [UN DESA, World Population Ageing 2019]. The base is small, the slope is steep, and the institutional capacity to absorb is uneven.
Sub-Saharan Africa stands almost alone. The region’s median age is 19, fertility averages 4.0 children per woman, and the share of population aged 65 or older is around 3 per cent today, projected to rise only to about 5 per cent by 2050 [UN DESA, 2024]. Africa’s youth labor force is projected to grow by 76 million through 2050 — even as every other world region’s young-worker pool contracts [ILO, Global Employment Trends for Youth 2024].
Northern America is aging steadily but not catastrophically. The U.S. fertility rate is 1.63; the population aged 65 and over will roughly double from 45 million today to about 90 million by 2050 [UN DESA, 2024]. Medicare and Social Security already consume 36 per cent of U.S. federal spending.
Latin America and the Caribbean crossed the replacement threshold in 2014 and sat at a regional TFR of 1.8 in 2024 [ECLAC, Demographic Observatory 2025]. Aging here will arrive faster than it did in Europe, but with substantially less institutional infrastructure.
Oceania is bifurcated. Australia and New Zealand resemble Northern Europe; Papua New Guinea and the smaller Pacific states still show high fertility and very different age structures.
South Asia is a hinge. India’s TFR fell to 1.96 in 2024 — below replacement for the first time in its recorded history [World Bank, 2024]. Bangladesh and Sri Lanka have also crossed the line. Yet the region still accounts for 25 per cent of global under-five deaths [UNICEF, Levels & Trends in Child Mortality 2024], a reminder that old-age dependency does not displace child mortality as a problem; both can compound.
The pattern is not “rich countries old, poor countries young.” It is closer to this: countries that finished their fertility transition early are old now, countries that finished it late are aging fast, and one region — sub-Saharan Africa — has not yet finished it at all.
Clinical Perspective. When a colleague says “aging populations,” verify the country. The geriatric problem in Seoul is not the geriatric problem in Lagos, and the policy that helps one will be irrelevant or counterproductive in the other. The granularity of region matters more than the global headline.
The Engines: Fertility, Infant Mortality, and the Vanishing Young Worker
Three numbers — births per woman, infant survival, and young-adult labor participation — together set the pace at which a society ages.
Fertility is the dominant force. Africa’s regional TFR of 4.0 (close to three times Europe’s 1.4) explains why Africa’s median age in 2050 will still be 25 while Europe’s will be 47 [UN DESA, 2024; Pew Research, 2025]. Replacement is 2.1, not 2.0, because not every child reaches reproductive age. By population-weighted average, Asia, North America, and South America each sit at about 1.7; Europe at 1.4; Oceania at 2.1; Africa at 4.0 [UN DESA, World Fertility 2024].
Infant and child mortality is the silent reciprocal. Globally, the under-five mortality rate fell roughly 60 per cent since 1990, but progress has slowed sharply since 2015 [UNICEF, 2024]. Sub-Saharan Africa’s under-five mortality stands at 71.6 deaths per 1000 live births — about 14 times the rate in Europe and Northern America [WHO, Child mortality fact sheet, 2025]. Children born in sub-Saharan Africa accounted for 58 per cent of under-five deaths globally in 2024. Persistently high child mortality, paradoxically, sustains high fertility: in low-survival environments, families bear more children to ensure some survive.
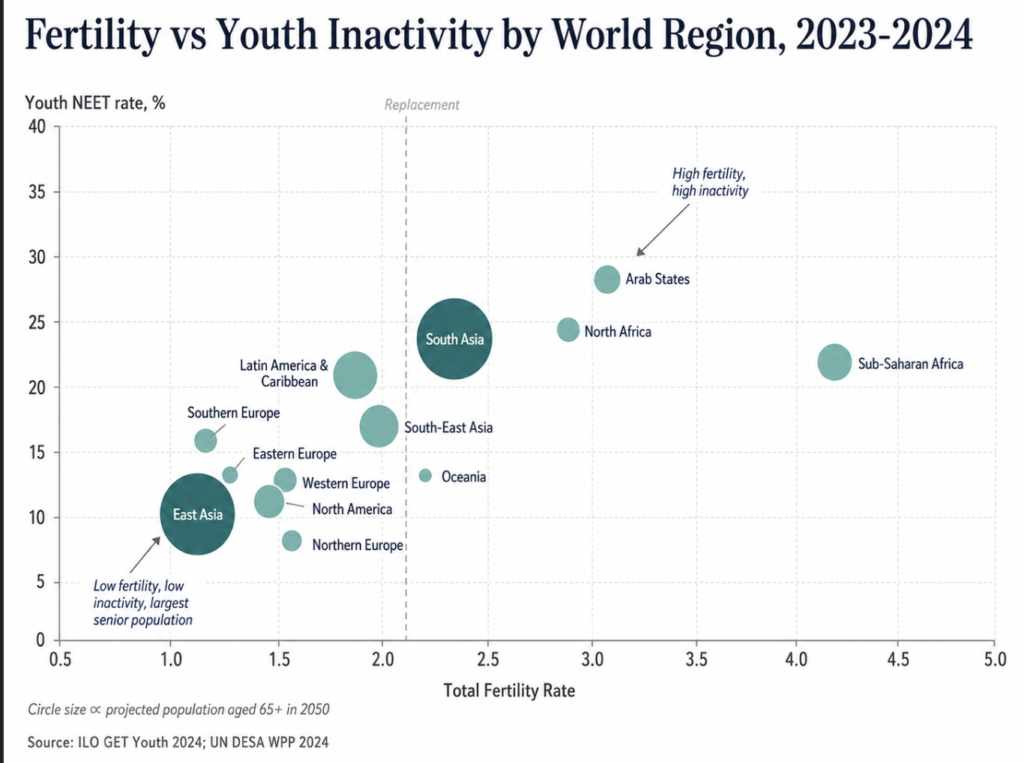
Young-adult labor participation is the indicator policy economists most often miss. Global youth unemployment sits at 13 per cent in 2024, but the more telling metric is NEET — young people not in employment, education, or training. In 2023, 256 million 15-to-24-year-olds globally fell into this category, or 20.4 per cent of the youth population [ILO, Global Employment Trends for Youth 2024]. The regional split is severe:
| Region (ILO subregion) | Youth NEET rate (2023) |
|---|---|
| Arab States | 33.2% |
| North Africa | 31.2% |
| South Asia | 26.4% |
| Latin America & Caribbean | ~21% |
| Sub-Saharan Africa | 20.4% |
| Eastern Europe | 12.9% |
| East Asia | 10.9% |
| Northern/Western/Southern Europe | <15% |
| North America | <15% |
In high-income countries, four in five young adult workers (ages 25-29) hold regular paid jobs. In low-income countries, only one in five [ILO, 2024]. The implication for global aging is direct: in the regions where the demographic dividend is theoretically largest, the educational and labor-market structures that would convert young populations into productive workers are weakest.
Done right, a country at TFR below 2.1 with high female labor participation, low youth NEET, and rising health spending can stabilize its dependency math. Done wrong, the result is an aging population whose young are neither working nor producing.
Clinical Perspective. Demography is not destiny — but it is the field on which destiny gets contested. The countries that win against aging will not be those with the most young people; they will be those who can convert the young people they have into healthy, productive adults.
What Aging Will Cost
Translated into ledger entries, the demographic shift produces three predictable bills: more pension payments, more healthcare spending, and fewer workers to pay for either.
The OECD old-age dependency ratio — retirees per 100 working-age adults — rose from 19 per cent in 1980 to 31 per cent in 2023, and is projected to climb to 52 per cent by 2060 [OECD, 2025]. The same ratio will exceed 80 per cent in Japan and Korea over the same period. Europe’s regional figure is forecast at 75 per cent by 2050 — substantially higher than Asia or Latin America at about 56 per cent [IMF, 2020]. In plain language: in the most rapidly aging societies, every working adult will, on average, be supporting close to one retiree in addition to themselves.
Healthcare spending follows the curve. Across OECD countries, expenditure on people aged over 65 runs roughly four times higher per capita than on younger adults, rising to six- to nine-fold for the oldest groups [OECD, 2024]. Public health spending across the OECD is projected to grow at an average annual rate of 2.6 per cent through 2040, reaching 8.6 per cent of GDP — an increase of 1.8 percentage points from 2018 [OECD, 2024]. Long-term-care expenditure is projected to roughly double by 2050; under demand pressure, current LTC expenditures across the OECD may multiply by 2.5 times [OECD, Is Care Affordable for Older People?, 2024].
Workforce shortage compounds the bill. WHO now projects a global shortage of 11 million health workers by 2030 — revised upward from 10 million as donor cuts and migration patterns worsened — with the majority falling in low- and middle-income countries [WHO, Global Strategy on Human Resources for Health: Workforce 2030, updated 2025]. In Africa alone, the projected shortfall is now 600,000 workers larger than earlier estimates anticipated.
GDP per capita growth in the OECD is expected to drop from roughly 1.1 per cent per year in the 2010s to about 0.4 per cent per year over 2024-2060, largely because the working-age population will shrink by 8 per cent across the OECD and by more than 30 per cent in over a quarter of OECD countries [OECD, 2025].
The arithmetic does not negotiate. More retirees, fewer workers, more disease, fewer caregivers. Every demographic ledger in the rich world says roughly the same thing.
Clinical Perspective. A 2.5-fold rise in long-term-care spending by 2050 is not a budget item — it is a structural reconfiguration of the welfare state. Countries that wait for the costs to materialize before reforming pension ages, immigration policy, and productivity systems will discover, with finality, that demography does not pause for legislative consensus.
The Optimistic Wager: How AI Medicine Could Bend the Curve
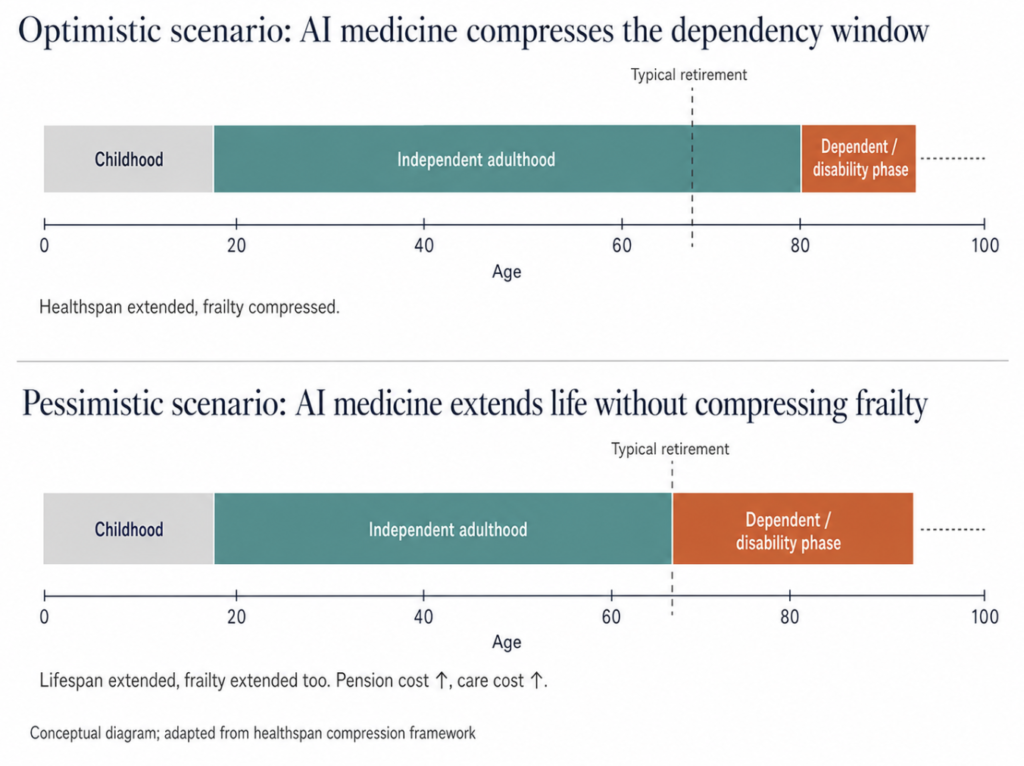
Into the ledger walks artificial intelligence with a specific argument: most of the cost of aging is not lifespan but healthspan — the years lived with significant disability or chronic disease. Shrink that gap, the argument goes, and the bill shrinks with it.
The geriatric framework most often cited groups intervention into four domains, the so-called 4Ms: what Matters, Medication, Mentation, and Mobility [Age-Friendly Health System framework, John A. Hartford Foundation/IHI]. AI tools map onto each. Predictive analytics layered onto electronic health records can flag falls weeks before they occur, polypharmacy risks before adverse events, and cognitive decline before it presents clinically. Wearables and remote-monitoring platforms allow chronic disease management at home, deferring nursing-home admission — the single largest cost driver in late-life care.
Drug discovery is a separate optimistic case. AI-driven biomarker identification has accelerated work on senolytics, GLP-1 analogues with possible cognitive effects, and aging-clock interventions that may, within a decade, target biological aging directly. None of this replaces clinical trials, but it shortens the front end.
Productivity is the third lever. The OECD itself has identified technology adoption as one route to lower long-term-care costs by an estimated 13 per cent by 2050, through promoting healthy aging and care-worker productivity gains [OECD, 2024]. Japan and the Nordic countries are already deploying assistive robotics, voice-activated home interfaces, and AI-augmented care coordination at scale.
The optimistic wager is not that AI cures aging. It is narrower and more defensible: that AI medicine, deployed at scale, can compress the period of expensive frailty into a smaller window at the end of a longer life. If the average older adult enters dependent care at 82 rather than 75, the welfare-state arithmetic moves meaningfully in the right direction.
Clinical Perspective. The strongest case for AI in geriatrics is not diagnostic glamour but logistical reach. A care system with a shrinking workforce cannot, by definition, deliver more human touch per patient — it can only deliver more system per touch. If AI tools genuinely free clinician time for the parts of care that require humans, they earn their cost. If they add a screen to an already screen-saturated visit, they do not.
The Pessimistic Wager: Where AI Medicine Could Make It Worse
Three structural problems undercut the optimistic case.
The first is geography. The countries with the most rapidly aging populations and the highest absolute number of older adults — China, India, Japan, the United States, the EU — are also the countries best positioned to deploy AI medicine. The countries with the steepest proportional rise in older persons and the weakest infrastructure to support them — northern Africa, western Asia, much of Latin America — are not. AI medicine, on its current trajectory, is most available where it is least demographically urgent, and least available where geriatric infrastructure will need to expand fastest. The promised efficiency gain may simply not arrive in the regions that need it most.
The second is bias. Algorithmic models trained on younger, wealthier, and more digitally literate populations systematically underperform on older adults, particularly those with multiple comorbidities, sensory impairment, or low digital literacy. Algorithmic bias and digital ageism in clinical AI are already documented in the literature [Mannheim et al., 2023]. A predictive model that misclassifies frailty in a 78-year-old patient does not gain time for the system; it consumes it on downstream errors.
The third is substitution. There is a real risk that AI in geriatric care displaces, rather than augments, human contact at the moment human contact matters most. Care of the dying, severe dementia, and loneliness do not, on current evidence, improve under chatbot substitutes for human caregivers. A care system that uses AI to reduce per-patient labor input may discover, downstream, that it has solved a budget problem while creating a dignity problem.
There is also a longevity-pension paradox worth naming. If AI medicine adds five years of healthy life without a corresponding extension of working life, the welfare-state math gets worse, not better. Every extra year of healthy retirement is a year of pension payment without contribution. Aging policy and AI medicine policy cannot be designed in isolation; they must move together, or the better outcome at the level of individual health becomes the worse outcome at the level of national finance.
Treated as augmentation, AI medicine can flatten the cost curve of global aging by a meaningful amount. Treated as a substitute for the political work of pension reform, immigration policy, and care-workforce investment, it becomes an expensive distraction from problems that algorithms cannot solve. The honest answer about whether AI medicine can solve global aging is: not by itself, not everywhere, and not without choices that are political rather than technical.
Clinical Perspective. Global aging will be navigated, not resolved. AI medicine is a powerful headwind against demographic gravity, but it is not anti-gravity. The countries that handle the next thirty years best will be those that combine intelligent technology, intelligent immigration, intelligent retirement-age reform, and intelligent investment in young workers — both at home and, through trade and development, in the one region of the world that will still have them. The least informed view is that AI alone will be enough. The second least informed is that it will not matter.
Key Takeaways
- The world’s 65-and-over population will pass 2.2 billion by the late 2070s and outnumber children under 18 — a reversal without historical precedent.
- Aging is regional, not uniform; East Asia and Southern Europe are aging fastest, while sub-Saharan Africa remains the only major region with population-replacing fertility.
- Old-age dependency ratios will exceed 75 per cent in Europe and 80 per cent in Japan and Korea by 2050-2060, restructuring every welfare-state assumption built since 1945.
- Long-term-care spending across the OECD is projected to more than double by 2050, while the global health workforce shortfall is projected at 11 million by 2030.
- AI medicine can meaningfully compress healthspan into lifespan, but only where infrastructure, equity, and policy reform travel with it.
- The optimistic and pessimistic scenarios are not mutually exclusive: AI medicine will likely soften the curve in the rich, aging world and barely touch it in the rapidly aging poor world.
FAQ
Which region is aging fastest? East Asia, by most measures. China’s share of population aged 65 and older rose from 7 per cent in 2000 to 15 per cent in 2024, and is projected to reach roughly 33 per cent by 2050 [UN DESA, 2024]. South Korea and Japan follow a similar trajectory, with old-age dependency ratios projected to exceed 80 per cent by 2060 [OECD, 2025]. Northern Africa and Western Asia show the fastest proportional rise in older persons but from a much smaller base.
Can AI fix the healthcare worker shortage caused by aging? Partially. The WHO projects a global shortage of 11 million health workers by 2030, concentrated in low- and middle-income countries [WHO, 2025]. AI tools can extend the reach of existing workers through remote monitoring, decision support, and administrative automation, but they do not produce new clinicians. The shortage is structural; technology can ease it, not erase it.
Does declining fertility mean populations will collapse? Not in the next several decades. Global population is still projected to peak around 10.3 billion in the mid-2080s [UN DESA, 2024]. Past growth embedded in today’s youthful age structure will add roughly 1.4 billion people through 2054. Decline, where it occurs, will be regional and gradual rather than global and sudden.
Will AI medicine extend lifespan or healthspan? Most likely healthspan first, with lifespan effects following more slowly. Current AI applications in geriatric care — fall detection, medication management, chronic-disease monitoring, early cognitive screening — primarily compress the years of disability at the end of life [Wang et al., 2025]. True lifespan extension via aging biology remains experimental.
References
- United Nations, Department of Economic and Social Affairs, Population Division. World Population Prospects 2024: Summary of Results. New York: UN DESA; 2024.
- United Nations, Department of Economic and Social Affairs, Population Division. World Population Ageing 2019 (Highlights). New York: UN DESA; 2020. ST/ESA/SER.A/430.
- United Nations, Department of Economic and Social Affairs, Population Division. World Fertility 2024. New York: UN DESA; 2025.
- International Labour Organization. Global Employment Trends for Youth 2024: Decent Work, Brighter Futures. Geneva: ILO; 2024.
- World Health Organization. Child mortality (under 5 years). Geneva: WHO; 2025.
- World Health Organization. Newborn mortality. Geneva: WHO; 2024.
- OECD. The Economic Benefit of Promoting Healthy Ageing and Community Care. Paris: OECD Publishing; 2025.
- OECD. Is Care Affordable for Older People? Paris: OECD Publishing; 2024.
- World Health Organization. Global Strategy on Human Resources for Health: Workforce 2030. Geneva: WHO; 2016 (updated 2025).
- Boniol M, Kunjumen T, Nair TS, et al. The global health workforce stock and distribution in 2020 and 2030: a threat to equity and ‘universal’ health coverage? BMJ Glob Health. 2022;7(6):e009316.
- UNICEF, WHO, World Bank Group, UN DESA Population Division. Levels & Trends in Child Mortality: Report 2024. New York: UNICEF; 2025.
- Economic Commission for Latin America and the Caribbean (ECLAC). Demographic Observatory 2025 — Low Fertility in Latin America and the Caribbean. Santiago: CEPAL; 2025.
- Liu JX, Goryakin Y, Maeda A, Bruckner T, Scheffler R. Global health workforce labor market projections for 2030. Hum Resour Health. 2017;15(1):11.
- Mannheim I, Wouters EJM, Köttl H, van Boekel LC, Brankaert R, van Zaalen Y. Ageism in the discourse and practice of designing digital technology for older persons: a scoping review. Gerontologist. 2023;63(7):1188-1200.
- Abadir M, Dineen W, Myers D, Yu S, Phan P. Navigating the future of artificial intelligence technologies for improving the care of older adults. Innov Aging. 2025 Sep 25;9(Suppl 1):S24-S32. doi: 10.1093/geroni/igaf092.
Joonpyo Hong, MD is a board-certified otolaryngologist practicing in Korea. This article reflects his clinical interpretation of published research and does not constitute individual medical advice.
This article is not intended to advertise or promote any specific company or product.
For more interesting contents:
https://curiousmd.com/cancer-of-unknown-primary-prognosis/
https://curiousmd.com/ai-speech-clarification-hearing-loss/
https://curiousmd.com/ai-de-escalation-in-hpv-throat-cancer/
Link out to:
UN World Population Prospects 2024:
https://www.un.org/development/desa/pd/world-population-prospects-2024
WHO – Global Strategy on Human Resources for Health: Workforce 2030:
https://www.who.int/teams/health-workforce/global-strategy
OECD – Is Care Affordable for Older People? (2024):
https://www.oecd.org/en/publications/is-care-affordable-for-older-people_450ea778-en.html
ILO – Global Employment Trends for Youth 2024:
https://www.ilo.org/publications/major-publications/global-employment-trends-youth-2024
UNICEF – Levels & Trends in Child Mortality 2024:
https://data.unicef.org/resources/levels-and-trends-in-child-mortality-2024/