
A clinical-stage company with one lead asset schedules a Phase 2 readout. The science is credible, the mechanism is well described, and the early safety data contained nothing alarming. Analysts publish previews. Then the envelope opens, the primary endpoint is missed by a margin that would look trivial in any other industry, and by the time trading settles the company is worth a fraction of what it was worth the previous afternoon. Nothing about the underlying biology changed overnight. What changed was that a number became known.
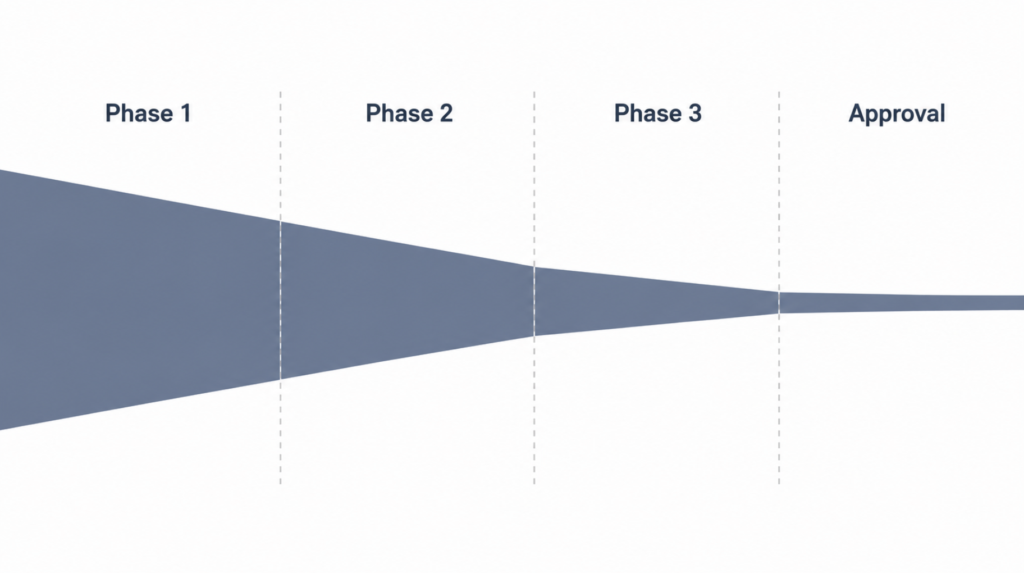
That scene is not an anomaly in drug development. It is the mechanism by which value is created and destroyed in the sector. Across 21,143 compounds and more than 406,000 clinical trial records, one large analysis estimated that 13.8% of drug development programs entering Phase 1 eventually reach approval — roughly one in seven, and earlier work using different methods put the figure closer to one in ten [Wong, Estimation of Clinical Trial Success Rates, 2019].
Here is the tension worth sitting with. Small and mid-size biotechnology companies are not a sideshow to pharmaceutical innovation; they now originate most of it. And the very features that let them do that work — concentrated bets, no revenue, long horizons, information that arrives in a single block — are what make small-cap biotech investing so punishing for an individual to attempt. The difficulty is not a failure of discipline on the investor’s part. It is structural.
The innovation is real, and it is concentrated in small companies
Any honest account has to start by conceding what the sector gets right. Emerging biopharmaceutical companies — generally defined by modest revenue and research budgets — have moved from the periphery to the center of drug discovery. Of 394 novel active substances launched globally between 2020 and 2024, emerging companies originated 258, or roughly two-thirds. The same pattern holds upstream: a record 65% of molecules in the research pipeline are being advanced without a larger company involved, up from about a third at the start of the century [IQVIA Institute, Emerging Biopharma’s Contribution to Innovation].
This matters for how the sector should be read. A portfolio of pre-revenue biotechnology companies is not a collection of lottery tickets detached from real science. Many of them are doing the first-in-class work that larger firms increasingly prefer to acquire rather than originate. Dismissing the whole category as speculation misreads where new medicines actually come from.
But originating innovation and rewarding shareholders are two different questions, and the second does not follow from the first. A company can discover something genuinely new, advance it through years of trials, and still deliver nothing to the people who financed the discovery — because the drug fails, or because the capital raised along the way left each original share owning a much smaller slice of the result. Scientific contribution and shareholder return are related, but they are not the same ledger.
Clinical Perspective. The clinical literature and the investment case draw on the same trials but ask different questions of them. A physician reading a Phase 2 result asks whether the effect is real and clinically meaningful. An owner of the stock is implicitly asking something harder: whether that effect will survive a larger, longer, better-controlled study, and whether the company will still be solvent and undiluted when it does.
A brutal reality of small-cap biotech: The arithmetic of attrition
Start with the base rate, because most disappointment in this sector is a failure to internalize it. Estimates of the probability that a program entering Phase 1 reaches approval cluster in a narrow band: 13.8% in the largest analysis, 9.6% and 10.4% in two widely cited predecessors [Wong, Estimation of Clinical Trial Success Rates, 2019]. Put plainly, between eight and nine of every ten programs that begin human testing will never become a medicine.
The average conceals enormous variation by disease. Oncology, the most crowded area in drug development, showed an overall success rate of 3.4% — about one program in thirty. Even restricting the analysis to each drug’s lead indication, where a company concentrates its best evidence, oncology reached only 11.4%. Vaccines, at the other end, reached 33.4%. Time compounds the difference: the median program spent between 5.9 and 7.2 years in clinical testing outside oncology, and 13.1 years within it [Wong, Estimation of Clinical Trial Success Rates, 2019].
Two cautions belong here, and both are instructive rather than pedantic.
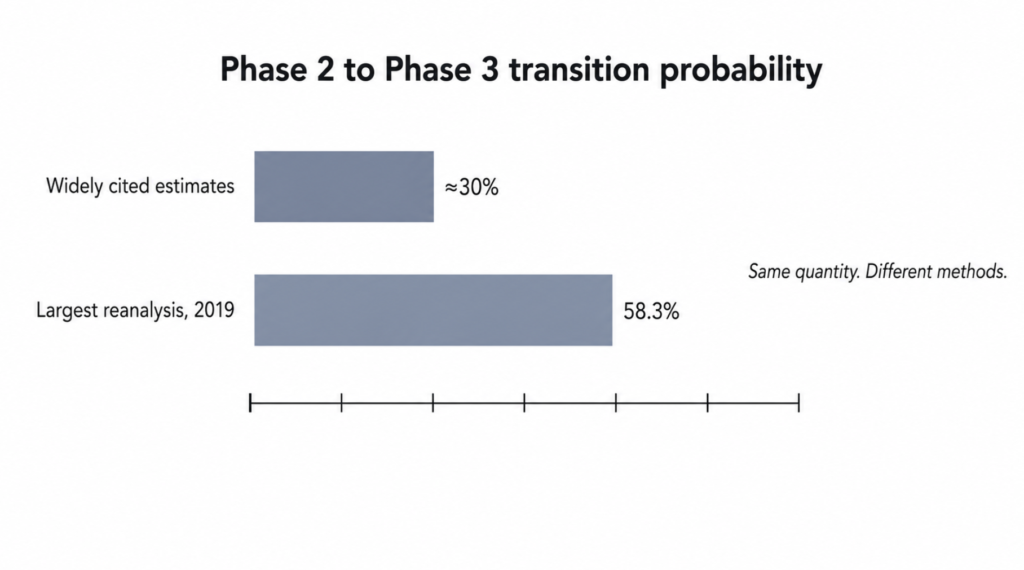
The first concerns where failure concentrates. It is conventional to describe Phase 2 as the great filter, the point at which efficacy is first tested honestly and most candidates die. The most widely cited estimates support this, putting the Phase 2 to Phase 3 transition near 30%. The largest reanalysis of the question disagrees, estimating that transition at 58.3% — nearly double — and attributing the gap to its method of reconstructing programs where trial records were missing [Wong, Estimation of Clinical Trial Success Rates, 2019].
The direction of the finding is consistent: Phase 2 is a hard gate. The magnitude is not settled, and the disagreement is not a footnote. Valuation models are built by chaining these transition probabilities together, so a factor-of-two dispute in one link changes the answer the model produces.
The second concerns the cost of the enterprise, where the published range is wider still. One influential analysis estimated the capitalized cost of bringing a drug to market at $2.56 billion in 2013 dollars, a figure that had risen 8.5% per year above general inflation since the same group’s previous survey [DiMasi, Innovation in the Pharmaceutical Industry, 2016]. A later study drawing on public company filings estimated a median of $985 million and a mean of $1.34 billion in 2018 dollars [Wouters, Estimated R&D Investment to Bring a New Medicine to Market, 2020]. The estimates differ by more than a factor of two because they rest on different samples, different assumptions about failed programs, and different costs of capital.
Against these costs, productivity has been moving the wrong way for a long time. The number of new drugs approved per billion dollars of research spending has halved roughly every nine years since 1950, an inflation-adjusted decline of about eighty-fold [Scannell, Diagnosing the Decline in Pharmaceutical R&D Efficiency, 2012].
The odds are long, the timelines are measured in decades for some diseases, and the industry cannot agree within a factor of two on what any of it costs.
Clinical Perspective. The disagreement over the Phase 2 transition rate deserves more attention than it usually gets. It is not a quarrel between a right number and a wrong one; it is a demonstration that even the best-resourced analyses of this industry, working from proprietary databases, arrive at materially different pictures of where drugs fail. Any valuation that presents a single probability of success is presenting a choice of method as though it were a measurement.
Value arrives all at once
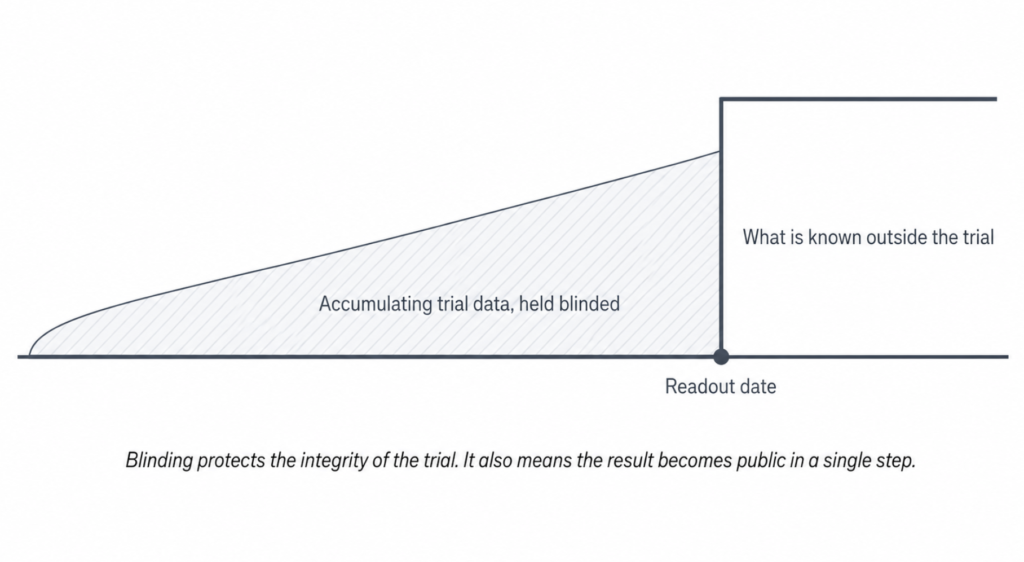
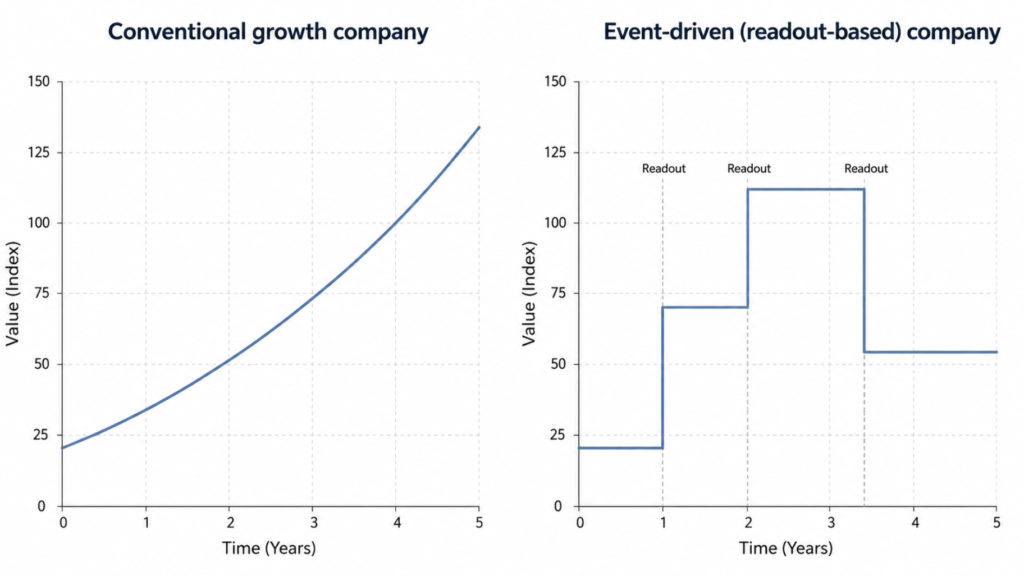
In most industries, a company’s worth accumulates through something observable and continuous — revenue, margin, subscriber counts, orders. Clinical-stage biotechnology does not work that way. Its value is created by the removal of risk, and risk is removed by experiments. Because those experiments are blinded to protect their integrity, the result does not leak out gradually. It exists in a sealed form and then, on a scheduled date, it does not.
This produces a return profile that is genuinely different in kind, not merely in degree. An event study covering 13,807 clinical trials from 2000 to 2020 — among the largest of its type — found that the single factor most associated with the size of the market reaction was whether the sponsor was an early-stage biotechnology company or a large pharmaceutical firm, followed by the disease, the outcome, the trial phase, and the enrollment target. The same analysis reported that these characteristics, taken together, still did not explain most of the variation in returns [Singh, Reaction of Sponsor Stock Prices to Clinical Trial Outcomes, 2022].
That second finding is the more useful one. It means the amplitude of these events is not merely large; it is substantially unpredictable even to researchers who know the trial’s phase, its size, its indication, and its outcome in advance. A single asset is not diversified by being well understood.
There is a further trap in the word positive. A trial can meet its primary endpoint and still disappoint a market that had priced in a larger effect, a cleaner safety profile, or a faster path to filing. The scientific verdict and the financial verdict are rendered by different juries applying different standards.
Clinical Perspective. Physicians are trained to read a trial result as a statement about a population: this intervention produced this effect, with this confidence interval, in these patients. Markets read the same result as a statement about a company’s future cash flows, filtered through what had already been assumed. The two readings diverge most sharply when a drug works modestly — a result a clinician may find useful and an owner may find ruinous.
The cost of having no revenue
A company with no product on the market has one reliable source of funding: selling more of itself. Clinical-stage biotechnology firms finance operations largely through equity issuance, supplemented by partnerships and milestone payments. Each raise converts scientific progress into cash, and each raise leaves existing owners with a smaller claim on whatever that progress eventually produces.
The pressure intensifies as programs advance, because later trials are larger, longer, and more expensive than earlier ones. A Phase 3 program enrolls more patients across more sites and runs for years — the median Phase 3 trial ran 3.8 years in the analysis cited above [Wong, Estimation of Clinical Trial Success Rates, 2019]. Success at Phase 2 is therefore not a moment of financial relief. It is the moment the burn rate is committed to rising.
Timing makes this worse. Capital is most expensive precisely when a company most needs it — after a disappointing result, when the share price has fallen and the same amount of money requires issuing far more stock. Companies that anticipate this often raise after good news instead, which caps the upside of the good news. Either way, the share count tends to move in one direction.
Because almost all of the expected value sits years in the future, the sector’s valuations are unusually sensitive to the cost of capital. This is a structural argument rather than a proven causal one, but the logic is straightforward: when discount rates rise, distant cash flows lose more value than near ones, and a company whose entire worth is a distant cash flow loses the most.
| Conventional growth company | Clinical-stage biotechnology company | |
|---|---|---|
| Source of value | Revenue and margin expansion | Removal of scientific and regulatory risk |
| How information arrives | Continuously, each quarter | In blocks, on scheduled readout dates |
| Effect of bad news | Growth rate revised downward | Lead asset may be worth nothing |
| Funding of operations | Increasingly from internal cash flow | Repeated equity issuance, with dilution |
| Typical horizon to proof | Quarters | Years, and over a decade in oncology |
| Basis for valuation | Earnings and revenue multiples | Probability-weighted future cash flows |
Clinical Perspective. Trial timelines and financing timelines are set by different logics and rarely align. Enrollment slows because eligible patients are scarce or sites underperform — routine clinical realities with no financial malice in them. But a delay that a principal investigator would describe as unremarkable can consume the runway that was supposed to carry the company to its answer.
Pricing what cannot yet be priced
The standard tools of equity valuation assume something to divide. A company with no revenue and no earnings offers no multiple to apply, so analysts fall back on discounted cash flow, usually in the risk-adjusted form that weights each future cash flow by the probability that the program survives to produce it.
The method is sound in principle and unavoidable in practice. Its weakness is that its output is only as good as the probability assumptions fed into it — and the earlier section established that those probabilities are disputed by a factor of two at one of the most important links in the chain. A model of this kind can be highly precise and still be inaccurate, because precision describes the arithmetic and accuracy describes the assumptions. Small revisions to the probability of success, the peak sales estimate, or the discount rate move the resulting valuation enormously.
This is also where the individual investor’s position is genuinely disadvantaged, in a way that has little to do with intelligence or effort. The probability estimates cited throughout this article were not derived from public sources. They required commercial trial databases, and the researchers themselves noted that assembling accurate information on trial characteristics and outcomes is expensive, slow, and prone to error [Wong, Estimation of Clinical Trial Success Rates, 2019]. The raw material for a rigorous view of this sector sits behind subscriptions priced for institutions.
Sector-level returns show what all of this produces. The most widely followed equal-weighted biotechnology fund, which gives small clinical-stage companies weight comparable to large ones, returned roughly 1.5% annualized over the five years to mid-2026 — close to flat — while its trailing one-year return exceeded 70% and its three-year annualized return sat near 18%. The picture depends heavily on the window chosen, and these figures move quickly. What persists across every window is the amplitude.
Clinical Perspective. The strongest argument against concentrated positions in this sector is not that the science is weak — often it is excellent. It is that the distribution of outcomes for any single program is close to all-or-nothing, the timing of resolution is outside the owner’s control, and the base rates are unforgiving enough that being right about the biology is not sufficient. Understanding a drug is a scientific achievement. Owning the company that develops it is a separate wager, made on different terms, and it should be recognized as such.
Key Takeaways
- Between six and nine of every ten drug programs entering human testing never reach approval, and in oncology the figure is closer to twenty-nine in thirty.
- Emerging biopharmaceutical companies now originate roughly two-thirds of new medicines, so the sector’s difficulty is a problem of structure, not of scientific merit.
- Published estimates of both the Phase 2 transition rate and the cost of developing a drug differ by more than a factor of two, which means every valuation model in the sector inherits a contested input.
- Value in clinical-stage biotechnology is created by removing risk, and risk is removed in blocks on scheduled dates, producing outcomes that are close to binary.
- Repeated equity issuance means an investor can be correct about the science and still be diluted out of most of the reward.
- The data required to estimate success probabilities rigorously sits in commercial databases, which places individual investors at a structural information disadvantage.
FAQ
Are small biotechnology companies just speculative, without real science behind them?
No. Emerging biopharmaceutical companies originated 258 of the 394 novel active substances launched globally between 2020 and 2024, and account for a record share of the research pipeline advancing without a larger partner [IQVIA Institute, Emerging Biopharma’s Contribution to Innovation]. The difficulty of investing in them is a matter of odds, financing structure, and information access rather than scientific legitimacy.
Does a successful Phase 2 trial mean the drug will be approved?
No. Phase 2 is a significant hurdle but not the last one, and estimates of how many programs clear it differ substantially depending on method — one large reanalysis put the transition at 58.3%, against the roughly 30% reported by earlier studies [Wong, Estimation of Clinical Trial Success Rates, 2019]. Phase 3 trials are larger, longer, and more expensive, and they frequently overturn earlier signals.
Why do biotechnology stocks move so violently on trial results?
Because clinical trials are blinded, results become known all at once rather than accumulating gradually. An event study of 13,807 trials found that whether the sponsor was an early-stage biotechnology company was the factor most associated with the size of the market reaction, and that known trial characteristics still failed to explain most of the variation [Singh, Reaction of Sponsor Stock Prices to Clinical Trial Outcomes, 2022].
Does diversifying across several biotechnology companies remove the problem?
It depends. Spreading exposure reduces the impact of any single failure, but it does not change the underlying base rates, the dilution that accompanies repeated financing, or the sector’s sensitivity to the cost of capital. Sector-level returns over the five years to mid-2026 were roughly flat despite a sharp recent rally, which illustrates how much the answer depends on the period examined.
References
- Wong CH, Siah KW, Lo AW. Estimation of clinical trial success rates and related parameters. Biostatistics. 2019 Apr 1;20(2):273-286. Erratum in: Biostatistics. 2019 Apr 1;20(2):366.
- DiMasi JA, Grabowski HG, Hansen RW. Innovation in the pharmaceutical industry: new estimates of R&D costs. J Health Econ. 2016;47:20-33.
- Wouters OJ, McKee M, Luyten J. Estimated research and development investment needed to bring a new medicine to market, 2009-2018. JAMA. 2020;323(9):844-853.
- Scannell JW, Blanckley A, Boldon H, Warrington B. Diagnosing the decline in pharmaceutical R&D efficiency. Nat Rev Drug Discov. 2012;11(3):191-200.
- Singh M, Rocafort R, Cai C, Siah KW, Lo AW. The reaction of sponsor stock prices to clinical trial outcomes: an event study analysis. PLoS One. 2022;17(9):e0272851.
- IQVIA Institute for Human Data Science. Emerging Biopharma’s Contribution to Innovation; and Expanding Options for Emerging Biopharma in the U.S.: A Decade of Change.
Fund performance figures are as of mid-2026 and change continuously; current data should be consulted directly.
Joonpyo Hong, MD is a board-certified otolaryngologist practicing in Korea. This article reflects his clinical interpretation of published research and does not constitute individual medical advice.
This article is not intended to advertise or promote any specific company or product. Nothing in it constitutes investment advice or a recommendation regarding any security.
For more interesting content:
https://curiousmd.com/palantir-nhs-federated-data-platform/
https://curiousmd.com/polypharmacy-in-older-adults/
https://curiousmd.com/antibiotics-vs-antivirals-why-antivirals-are-rare/
Link out to:
https://pmc.ncbi.nlm.nih.gov/articles/PMC6409418/
https://doi.org/10.1001/jama.2020.1166
https://doi.org/10.1038/nrd3681
https://www.iqvia.com/insights/the-iqvia-institute/reports-and-publications/reports/emerging-biopharma-contribution-to-innovation