
Medical questionnaires are at the center of modern clinical research, but their questions do not always make sense to the patients who have to answer them. Some items assume situations many respondents never face. The Dizziness Handicap Inventory (DHI), one of the most widely used dizziness questionnaires in the world, asks whether symptoms make the respondent avoid heights. For someone whose daily life involves no heights at all, there is no clear answer. Another item asks whether dizziness interferes with work or household duties, without saying whether “interferes” means discomfort or an actual loss of function.
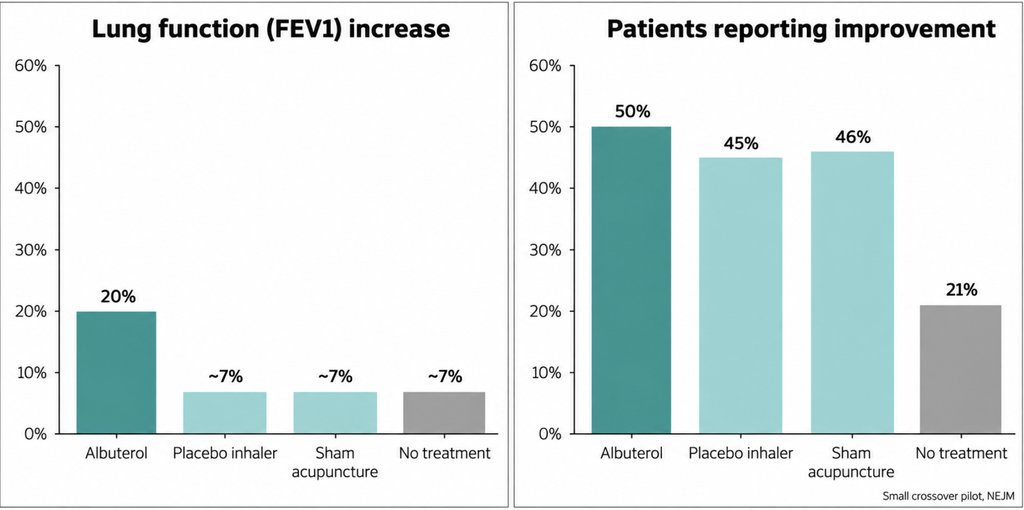
The research literature has a more serious version of the same problem. In a small but carefully blinded study published in the New England Journal of Medicine, people with asthma received an active bronchodilator, a placebo inhaler, sham acupuncture, or nothing at all. Lung function rose 20% with the real drug and about 7% with each of the other three, roughly three times as much. Yet the share who reported feeling better was 50% with the drug, 45% with the placebo inhaler and 46% with sham acupuncture [Wechsler, Active Albuterol or Placebo, 2011]. The dummy treatments felt almost as good as the drug.
Both problems tend to get the same verdict: questionnaires are subjective, so they are soft. That verdict comes too easily. Asking about feelings is rarely what goes wrong. What goes wrong more often is that the instrument was never built or calibrated for the person answering it. A standardized questionnaire is like an off-the-rack suit. It lets researchers compare thousands of people cut from the same pattern, but when the wearer’s life has a different shape, the shoulders sit wrong, and the number it produces is only as precise as the fit.
This article looks at why questionnaires earn their place, where top journals have caught them misleading, how a fair one is built and scored, and what happens when a global standard meets a life it was never cut for. Throughout, the question worth asking is less whether to trust a questionnaire than whether it was made to measure.
Can Medical Questionnaires Measure a Feeling?
Dizziness, pain, fatigue and their daily burden do not show up on a scan. They live in the patient’s experience, and asking is still the most direct way to reach them. That is why regulators accept structured questionnaires, called patient-reported outcome measures (PROMs) in research, as legitimate evidence. The US Food and Drug Administration (FDA) issued guidance in 2009 on using them to support treatment claims [FDA, PRO Guidance, 2009], and in October 2025 finalized broader guidance on selecting, building and modifying outcome assessments that are fit for purpose [FDA, PFDD Guidance 3, 2025].
The case for questionnaires also rests on an uncomfortable fact about “objective” tests: people read them too. When 115 pathologists in the United States interpreted single breast-biopsy slides, 6,900 interpretations in all, their diagnoses matched an expert consensus 75.3% of the time [Elmore, Diagnostic Concordance, 2015]. About one in four readings disagreed with the consensus, and for the borderline category of atypia, agreement fell to 48%, about half. Each pathologist saw only one slide per case, which is harder than routine practice, but the point stands. Objectivity comes in degrees. Machines do not own all of it, and patients are not shut out of it.
Measurement science separates two qualities that everyday language tends to blur. Reliability is consistency, like a bathroom scale that shows the same number every morning. Validity is whether that number is the thing you care about: the person’s actual weight. A scale with a misset zero is perfectly reliable and consistently wrong. Questionnaires can fail in either way, and the second kind of failure is harder to spot.
The case against questionnaires is real, too. Answers depend on memory, on mood, and on how far back a question asks people to look [Stull, Optimal Recall Periods, 2009], and expectation pushes subjective outcomes around more easily. Across 1,346 trials in 146 meta-analyses, a lack of blinding inflated treatment effects on subjective outcomes, while objective outcomes were essentially unaffected [Wood, Empirical Evidence of Bias, 2008]. A larger analysis put the average exaggeration from missing double-blinding at 13%, driven mainly by subjectively assessed outcomes [Savović, Study Design Characteristics, 2012]. So subjectivity itself is not the flaw. The flaw is subjectivity that nobody examines.
What the Top Journals Actually Do
If elite journals distrusted questionnaires, they would rarely publish them. Where anyone has counted, the opposite holds. Among 90 late-stage blood-cancer trials published in high-impact journals including the New England Journal of Medicine, The Lancet and JAMA, 73% included patient-reported outcomes as an end point, almost three in four [Patel, PROs in Blood Cancer Trials, 2024]. In heart-failure trials published in high-impact journals, the figure was 54.2% of 417, just over half [Eliya, PROs in Heart Failure Trials, 2021].
The same journals have also published the rules for doing it properly. JAMA carried the CONSORT-PRO extension for reporting questionnaire outcomes in trials in 2013 [Calvert, CONSORT PRO, 2013] and the SPIRIT-PRO guidance for building them into trial protocols in 2018 [Calvert, SPIRIT-PRO Extension, 2018]. Both exist because the problem was hard to miss: questionnaire results were often reported incompletely. The heart-failure review found that trials reported a median of 4 of the 11 CONSORT-PRO items. Among the blood-cancer trials, only 1 used a questionnaire as its main outcome, and just 39% of those collecting patient-reported data showed the results in the primary paper, fewer than two in five.
Survey research outside trials has been looser. An audit published in PLoS Medicine found that fewer than 7% of 165 medical journals gave authors any guidance on survey research, and that only 19% of 117 published survey studies reported whether their instrument was valid or reliable, fewer than one in five [Bennett, Reporting Guidelines for Survey Research, 2011]. Even the response rate, long treated as the default badge of quality, has been questioned in JAMA’s own pages. A commentary there argued that what matters is whether non-responders differ from responders, not the headline percentage [Johnson, Response Rates and Nonresponse Errors, 2012].
The asthma study fits here as well. It was a small crossover pilot, with 46 patients randomized and 39 completing, and its authors drew two lessons from it. Placebo relief rivaled the drug in how patients felt, and self-report alone could not tell the drug from the dummy. Neither lesson means the questionnaire was wrong. Taken together, they mean it was answering a different question from the spirometer.
| Objective measures (spirometry, imaging, lab tests) | Patient-reported measures (questionnaires) | |
|---|---|---|
| What it captures | Organ structure or function | Symptoms, limitations and daily burden as experienced |
| Main source of error | Equipment calibration, reader disagreement | Item wording, recall, cultural fit, interpretation |
| Most vulnerable to | Borderline categories and observer variation | Expectation effects when blinding fails |
| What it cannot do | Show how much the disease weighs on a life | Show what is happening inside the organ |
| Strongest use | Mechanism and disease activity | Whether a treatment matters to the person |
Top journals do not dismiss questionnaires as soft data. They ask them to show their working.
Building a Fair Questionnaire: From Items to Cut-offs
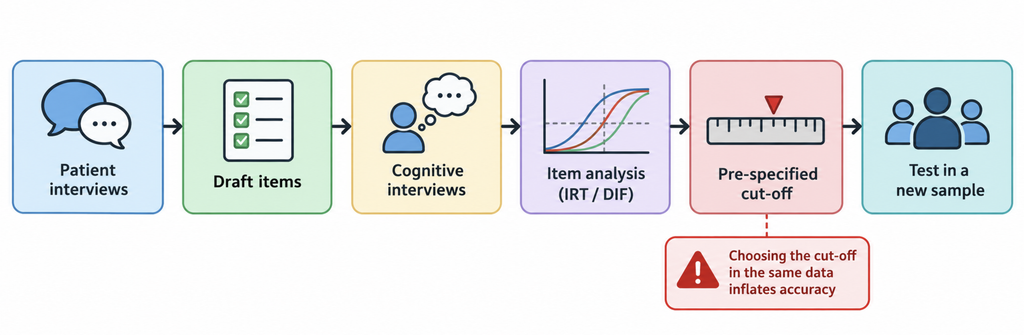
The international benchmark for judging a health questionnaire is COSMIN, a set of consensus-based standards for selecting measurement instruments. Its methodology for content validity, built from ratings by 159 experts in 21 countries, names content validity as the most important measurement property a questionnaire has, and the hardest one to assess [Terwee, COSMIN Content Validity, 2018]. Its 10 criteria start with the plainest question of all: are the items relevant to the people who will answer them? Comprehensibility, comprehensiveness and the fit of the response options come after. In practice, this means interviewing patients before writing any items, then having respondents think aloud as they answer, a technique called cognitive interviewing.
Modern statistics then test each item, not only the total. Item response theory (IRT) and its close relative, Rasch analysis, check how well every question separates people with more of the trait from people with less. A related check, differential item functioning (DIF), flags questions that behave differently across groups (older versus younger respondents, say, or one culture versus another) even when the underlying burden is the same [Deutscher, New Dizziness Impact Measures, 2024]. A question that works in one country and misfires in another will show up in this analysis, as long as someone runs it.
The cut-off, the score dividing normal from abnormal or mild from severe, is where hidden bias most often gets in. A common shortcut is to pick, within a single study, the threshold that gives the best combined sensitivity and specificity, and then report that same accuracy. Simulations show this flatters the result. If true sensitivity and specificity are both 84%, a study of 40 patients will typically report about 90%, and a study of 200 about 86% [Leeflang, Data-Driven Cutoff Bias, 2008].
A JAMA Network Open analysis using data from 44,503 participants on the PHQ-9 depression questionnaire found that small studies of 100 people landed on the population’s best cut-off of 8 or higher only 17% of the time, fewer than one in five, and overstated sensitivity by 6.4 percentage points [Levis, Data-Driven Cutoff Selection, 2024].
The remedy is size and pooling. An individual-participant meta-analysis in The BMJ, drawing on 17,357 participants from 58 studies, found that a PHQ-9 score of 10 or higher gave the best balance of sensitivity (0.88) and specificity (0.85) against clinician-administered interviews. That catches about 9 in 10 cases and correctly clears about 85 in 100 people without depression [Levis, Accuracy of PHQ-9, 2019]. The later, larger pooled dataset, which mixed different kinds of diagnostic interviews, pointed to 8. Change the yardstick and the best cut-off can move with it. A threshold is a finding to be re-tested, not a constant to be memorized.
Interpreting change runs into the same issue. The minimal clinically important difference (MCID), the smallest change patients would recognize as meaningful, is best anchored to what patients themselves report about their change, with statistical spread used only as support. It is not a fixed property of any instrument [Revicki, Minimally Important Differences, 2008]. For the DHI, published estimates of meaningful change range from about 18 points (US, based on measurement error) to 11 points (Norway, anchored to patients), and the two come from different populations and methods [Rizk, Item Level Psychometrics of the DHI, 2024; Tamber, Norwegian DHI Measurement Properties, 2009]. The answer depends on who is asked and how.
| Cut-off method | How it works | Strength | Risk of bias |
|---|---|---|---|
| Best threshold within a single study | Choose the score that maximizes accuracy in the same sample | Quick, needs one dataset | High: accuracy is overstated, especially in small samples |
| Pre-specified threshold, tested externally | Fix the cut-off first, then test it on new patients | Honest estimate of performance | Low, if the new sample resembles real users |
| Pooled individual-participant analysis | Combine raw data from many studies and test every threshold | Precise, can check subgroups | Low, but depends on which reference test is used |
| Anchor-based change threshold | Link score changes to patients’ own rating of improvement | Ties numbers to what patients notice | Moderate: varies by population and context |
A cut-off chosen from the data it is tested on is grading its own homework.
The Dizziness Handicap Inventory, Seen From a Korean Clinic
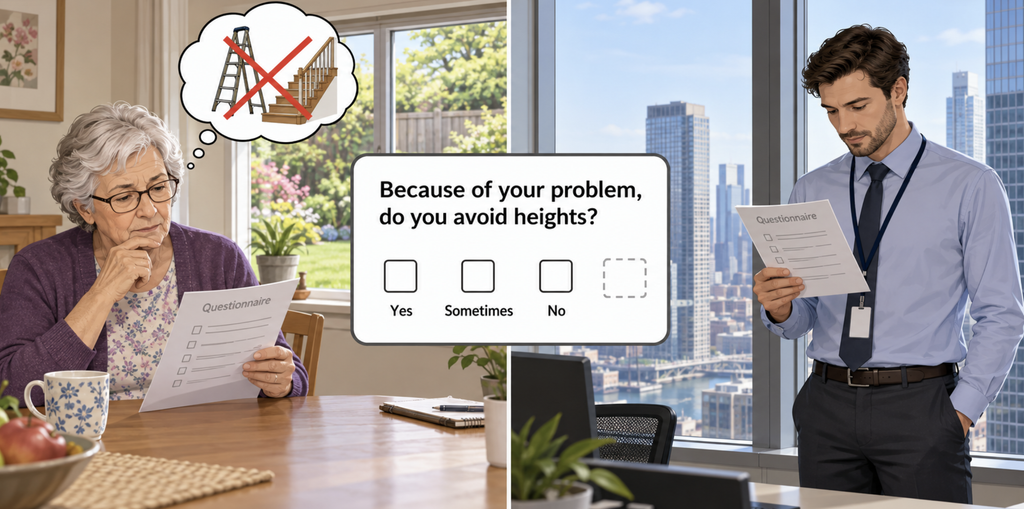
The Dizziness Handicap Inventory was published in the United States in 1990. It was cut down from 37 draft items to 25, grouped into functional, emotional and physical domains, and first tested on 106 consecutive patients [Jacobson, Development of the DHI, 1990]. The motivation was sound: balance tests could not put a number on what dizziness does to a life. Each item is answered yes, sometimes or no, scored 4, 2 or 0, for a total from 0 to 100. There is no box for “does not apply.”
In 2004, a multicenter group validated a Korean version across 14 hospitals [Han, Korean Adaptation of Dizziness Measures, 2004]. The translators adapted several items. The American “yardwork” became “strenuous housework,” because gardens are uncommon in Korean homes, and a list of dinners, films, dancing and parties became “social life such as eating out or attending gatherings.” Two items stayed as literal translations: whether symptoms make the respondent avoid heights, and whether they interfere with work or household duties.
The translation changed the answer scale as well. The original “yes” became 항상, which means “always.” In English, “yes” says the problem is present. In Korean, “always” sets the bar at maximum frequency, so a respondent who takes the word literally may hesitate to tick it even for a frequent, troublesome symptom.
The published validation describes a 40-patient pretest, but the feedback concerned layout and font size, not whether the items fit patients’ lives. Of 685 questionnaires returned, 588 complete DHIs were analyzed, so about one in seven returned forms did not make it into the DHI analysis. The authors also noted that their healthy comparison group was too small to propose a cut-off.
Korea is not the only case. Among 144 consecutive patients at a Chinese ENT clinic, 31.9% could not complete every DHI item on their own, nearly one in three, and even with a doctor guiding them, 18.1% still left items unanswered, nearly one in five [Fei, Clinical Practicality of the DHI, 2021]. A systematic review of 42 studies concluded that evidence for the DHI’s content validity is either lacking or limited and of low quality [Koppelaar-van Eijsden, Measurement Properties of the DHI, 2022].
Nobody has directly measured what a forced answer does to the total, but the mechanism is thought to cut both ways. A patient who never goes anywhere high may tick “no,” and the score comes out lower than the handicap would be if the situation arose. Another patient, unsure what else to choose, may tick “sometimes,” and the score drifts up. Either way, the item adds noise instead of information. The vague word “interferes” makes it worse. As people adapt to illness, the internal ruler they use to judge their own state shifts, something researchers call response shift [Sprangers, Response Shift, 1999].
The instrument has deeper seams, too. Factor analyses in Germany, Norway and Turkey (the Turkish one involving 2,111 patients) failed to reproduce the original three sub-scores [Kurre, Factor Analysis of the German DHI, 2010; Tamber, Norwegian DHI Measurement Properties, 2009; Ardıç, Subscales and Short Forms of the DHI, 2017], and the systematic review recommends relying on the total score alone [Koppelaar-van Eijsden, Measurement Properties of the DHI, 2022].
A Mayo Clinic analysis of 1,991 patients supported the total score while proposing a different set of sub-groupings [Van De Wyngaerde, Component Structure of the DHI, 2019]. The familiar mild (0 to 30), moderate (31 to 60) and severe (61 to 100) bands trace back largely to one retrospective study of 85 patients [Whitney, Perception of Handicap, 2004].
DHI scores also barely track the laboratory. In 799 patients, correlations with caloric testing, the video head impulse test and vestibular evoked myogenic potentials (VEMP) were close to zero [Yip, DHI Does Not Correlate, 2018]. In a separate clinic sample, psychological factors explained 53% of the variation in handicap scores, about half [Herdman, Vestibular Deficits and Psychological Factors, 2020]. That may say less about a flaw in the questionnaire than about what handicap actually is. The inner ear sets the stage, and the life around it decides how heavy the burden feels.
Is Anyone Fixing the Fit?

Some of the tailoring already exists. The Vestibular Disorders Activities of Daily Living Scale (VADL) asks about specific everyday tasks and was more responsive than the DHI at higher levels of impairment [Cohen, Vestibular Disorders ADL Scale, 2000]. Its Korean version, validated in the same study as the Korean DHI, includes an explicit “not applicable” option [Han, Korean Adaptation of Dizziness Measures, 2004]. So the same research team gave one scale a way out and left the other without one.
Item banks go further. The PROMIS program, developed with NIH funding, calibrated item banks on 21,133 people so that a computer can choose, one question at a time, the items that tell it the most about each respondent [Cella, PROMIS First Wave, 2010]. The approach has reached dizziness. Using DHI responses from 28,815 US rehabilitation patients, researchers rebuilt the questionnaire into separate functional, positional and emotional measures. An adaptive version needed a median of 8 questions to produce scores that correlated 0.99 with the full item bank, one third of the questions for a nearly identical score [Deutscher, New Dizziness Impact Measures, 2024].
For translations, the procedure is already written down: forward and back translation, an expert committee and a pretest [Beaton, Cross-Cultural Adaptation, 2000], with cognitive interviewing of target patients built into good practice [Wild, ISPOR Translation Principles, 2005]. Had the Korean “always” been tested this way, its higher threshold would at least have had a chance to surface.
No study has yet tested whether these tools solve the forced-answer problem in Korean practice, and tailoring has a cost of its own. A suit cut for one person cannot be compared with someone else’s on the same pattern. The more personal a questionnaire becomes, the harder it is to pool results across studies or countries. A bespoke questionnaire for every patient is not a realistic goal. A standard pattern with honest alterations is: a “not applicable” option where lives differ, item banks that skip irrelevant questions, and translations tested on the people who will actually answer them.
Key Takeaways
- Questionnaires are the most direct way to measure symptoms and daily burden, and regulators such as the FDA accept them as evidence when they meet defined standards.
- “Objective” tests carry human error too, so the useful question is whether an instrument’s errors can be found and counted.
- Leading journals publish questionnaire outcomes widely, and they have also published the reporting rules that expose their weak spots.
- Cut-off scores chosen and tested within one small study tend to overstate accuracy, so thresholds need large, pooled validation.
- The Dizziness Handicap Inventory has no “does not apply” option, and its Korean version renders “yes” as “always,” so scores can drift either way for reasons unrelated to the illness.
- Practical fixes exist, including “not applicable” options, adaptive item banks and tested translations, but they only help when patient objections are treated as data.
FAQ
Are medical questionnaires reliable enough to count as scientific evidence?
Yes, when they have been validated for the people using them. Regulators and leading journals accept questionnaire outcomes but expect evidence that the instrument is valid and reliable. Published work often leaves that evidence out: one audit found that only 19% of survey studies reported it [Bennett, Reporting Guidelines for Survey Research, 2011].
Why do dizziness questionnaires ask about situations that never happen?
Partly by design. The DHI was written decades ago for American patients and forces an answer of yes, sometimes or no, with no “does not apply” option. At one Chinese ENT clinic, nearly one in three patients could not complete every item on their own [Fei, Clinical Practicality of the DHI, 2021].
Does a DHI score show how damaged the inner ear is?
No. It measures perceived handicap, not organ function. In 799 patients, DHI scores showed close to zero correlation with caloric, head-impulse and VEMP results [Yip, DHI Does Not Correlate, 2018].
How should a questionnaire cut-off be chosen?
It depends on the purpose, but a cut-off should never rest on one small sample. Thresholds picked and tested on the same data look more accurate than they are, and pooled analyses of many studies give more trustworthy cut-offs [Levis, Data-Driven Cutoff Selection, 2024].
References
- Wechsler ME, Kelley JM, Boyd IO, et al. Active albuterol or placebo, sham acupuncture, or no intervention in asthma. N Engl J Med. 2011;365(2):119-126.
- U.S. Food and Drug Administration. Patient-Focused Drug Development: Selecting, Developing, or Modifying Fit-for-Purpose Clinical Outcome Assessments. Guidance for Industry, FDA Staff, and Other Stakeholders. October 2025.
- U.S. Food and Drug Administration. Patient-Reported Outcome Measures: Use in Medical Product Development to Support Labeling Claims. Guidance for Industry. December 2009.
- Elmore JG, Longton GM, Carney PA, et al. Diagnostic concordance among pathologists interpreting breast biopsy specimens. JAMA. 2015;313(11):1122-1132.
- Stull DE, Leidy NK, Parasuraman B, Chassany O. Optimal recall periods for patient-reported outcomes: challenges and potential solutions. Curr Med Res Opin. 2009;25(4):929-942.
- Wood L, Egger M, Gluud LL, et al. Empirical evidence of bias in treatment effect estimates in controlled trials with different interventions and outcomes: meta-epidemiological study. BMJ. 2008;336(7644):601-605.
- Savović J, Jones HE, Altman DG, et al. Influence of reported study design characteristics on intervention effect estimates from randomized, controlled trials. Ann Intern Med. 2012;157(6):429-438.
- Patel K, Ivanov A, Jocelyn T, et al. Patient-reported outcomes in phase 3 clinical trials for blood cancers: a systematic review. JAMA Netw Open. 2024;7(6):e2414425.
- Eliya Y, Averbuch T, Le N, et al. Temporal trends and factors associated with the inclusion of patient-reported outcomes in heart failure randomized controlled trials: a systematic review. J Am Heart Assoc. 2021;10(21):e022353.
- Calvert M, Blazeby J, Altman DG, et al. Reporting of patient-reported outcomes in randomized trials: the CONSORT PRO extension. JAMA. 2013;309(8):814-822.
- Calvert M, Kyte D, Mercieca-Bebber R, et al. Guidelines for inclusion of patient-reported outcomes in clinical trial protocols: the SPIRIT-PRO extension. JAMA. 2018;319(5):483-494.
- Bennett C, Khangura S, Brehaut JC, et al. Reporting guidelines for survey research: an analysis of published guidance and reporting practices. PLoS Med. 2011;8(8):e1001069.
- Johnson TP, Wislar JS. Response rates and nonresponse errors in surveys. JAMA. 2012;307(17):1805-1806.
- Terwee CB, Prinsen CAC, Chiarotto A, et al. COSMIN methodology for evaluating the content validity of patient-reported outcome measures: a Delphi study. Qual Life Res. 2018;27(5):1159-1170.
- Cella D, Riley W, Stone A, et al. The Patient-Reported Outcomes Measurement Information System (PROMIS) developed and tested its first wave of adult self-reported health outcome item banks: 2005-2008. J Clin Epidemiol. 2010;63(11):1179-1194.
- Leeflang MM, Moons KG, Reitsma JB, Zwinderman AH. Bias in sensitivity and specificity caused by data-driven selection of optimal cutoff values: mechanisms, magnitude, and solutions. Clin Chem. 2008;54(4):729-737.
- Levis B, Bhandari PM, Neupane D, et al. Data-driven cutoff selection for the Patient Health Questionnaire-9 depression screening tool. JAMA Netw Open. 2024;7(11):e2429630.
- Levis B, Benedetti A, Thombs BD; DEPRESsion Screening Data (DEPRESSD) Collaboration. Accuracy of Patient Health Questionnaire-9 (PHQ-9) for screening to detect major depression: individual participant data meta-analysis. BMJ. 2019;365:l1476.
- Jacobson GP, Newman CW. The development of the Dizziness Handicap Inventory. Arch Otolaryngol Head Neck Surg. 1990;116(4):424-427.
- Han GC, Lee EJ, Lee JH, et al. The study of standardization for a Korean adaptation of self-report measures of dizziness. J Korean Bal Soc. 2004;3(2):307-325.
- Fei Y, Zheng Y, Meng H, et al. Clinical practicality of the dizziness handicap inventory for evaluating dizziness in the Mandarin Chinese-speaking population: a prospective cross-sectional analysis. Int J Audiol. 2021;60(7):532-538.
- Koppelaar-van Eijsden HM, Schermer TR, Bruintjes TD. Measurement properties of the Dizziness Handicap Inventory: a systematic review. Otol Neurotol. 2022;43(3):e282-e297.
- Sprangers MA, Schwartz CE. Integrating response shift into health-related quality of life research: a theoretical model. Soc Sci Med. 1999;48(11):1507-1515.
- Ardıç FN, Tümkaya F, Akdağ B, Şenol H. The subscales and short forms of the dizziness handicap inventory: are they useful for comparison of the patient groups? Disabil Rehabil. 2017;39(20):2119-2122.
- Van De Wyngaerde KM, Lee MK, Jacobson GP, et al. The component structure of the Dizziness Handicap Inventory (DHI): a reappraisal. Otol Neurotol. 2019;40(9):1217-1223.
- Whitney SL, Wrisley DM, Brown KE, Furman JM. Is perception of handicap related to functional performance in persons with vestibular dysfunction? Otol Neurotol. 2004;25(2):139-143.
- Yip CW, Strupp M. The Dizziness Handicap Inventory does not correlate with vestibular function tests: a prospective study. J Neurol. 2018;265(5):1210-1218.
- Herdman D, Norton S, Pavlou M, et al. Vestibular deficits and psychological factors correlating to dizziness handicap and symptom severity. J Psychosom Res. 2020;132:109969.
- Cohen HS, Kimball KT, Adams AS. Application of the vestibular disorders activities of daily living scale. Laryngoscope. 2000;110(7):1204-1209.
- Deutscher D, Hayes D, Kallen MA. New dizziness impact measures of positional, functional, and emotional status were supported for reliability, validity, and efficiency. Arch Rehabil Res Clin Transl. 2024;6(1):100320.
- Beaton DE, Bombardier C, Guillemin F, Ferraz MB. Guidelines for the process of cross-cultural adaptation of self-report measures. Spine (Phila Pa 1976). 2000;25(24):3186-3191.
- Wild D, Grove A, Martin M, et al. Principles of good practice for the translation and cultural adaptation process for patient-reported outcomes (PRO) measures: report of the ISPOR Task Force for Translation and Cultural Adaptation. Value Health. 2005;8(2):94-104.
- Revicki D, Hays RD, Cella D, Sloan J. Recommended methods for determining responsiveness and minimally important differences for patient-reported outcomes. J Clin Epidemiol. 2008;61(2):102-109.
- Rizk HG, Velozo C, Shah S, et al. Item level psychometrics of the Dizziness Handicap Inventory in vestibular migraine and Meniere’s disease. Ear Hear. 2024;45(1):106-114.
- Tamber AL, Wilhelmsen KT, Strand LI. Measurement properties of the Dizziness Handicap Inventory by cross-sectional and longitudinal designs. Health Qual Life Outcomes. 2009;7:101.
- Kurre A, Bastiaenen CH, van Gool CJ, et al. Exploratory factor analysis of the Dizziness Handicap Inventory (German version). BMC Ear Nose Throat Disord. 2010;10:3.
Joonpyo Hong, MD is a board-certified otolaryngologist practicing in Korea. This article reflects his clinical interpretation of published research and does not constitute individual medical advice. This article is not intended to advertise or promote any specific company or product.
For more articles:
https://curiousmd.com/ai-doctor-recommendations-hidden-influence/
https://curiousmd.com/ai-clinical-trials-what-ai-replaces/
Link out to:
US FDA, Patient-Focused Drug Development guidance on fit-for-purpose clinical outcome assessments (2025): https://www.fda.gov/regulatory-information/search-fda-guidance-documents/patient-focused-drug-development-selecting-developing-or-modifying-fit-purpose-clinical-outcome
US FDA, Patient-Reported Outcome Measures guidance for supporting labeling claims (2009): https://www.fda.gov/regulatory-information/search-fda-guidance-documents/patient-reported-outcome-measures-use-medical-product-development-support-labeling-claims
NIH Common Fund, overview of PROMIS item banks and computerized adaptive testing: https://commonfund.nih.gov/promis/index
Korean Balance Society, the 2004 Korean validation study of the DHI and three other dizziness questionnaires (Korean full text): https://www.e-rvs.org/upload/pdf/0302307.pdf